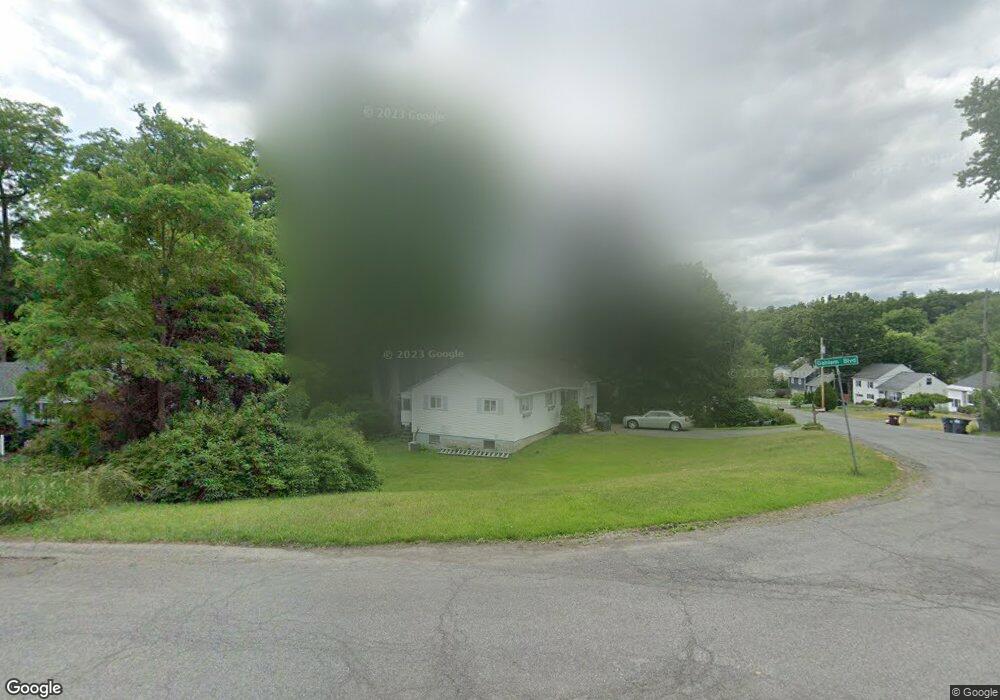
14 Dahlem Blvd Schenectady, NY 12309
Estimated Value: $296,000 - $328,000
3
Beds
2
Baths
1,128
Sq Ft
$278/Sq Ft
Est. Value
About This Home
This home is located at 14 Dahlem Blvd, Schenectady, NY 12309 and is currently estimated at $313,180, approximately $277 per square foot. 14 Dahlem Blvd is a home located in Albany County with nearby schools including Saddlewood Elementary School, Lisha Kill Middle School, and Colonie Central High School.
Ownership History
Date
Name
Owned For
Owner Type
Purchase Details
Closed on
May 7, 2008
Sold by
Birdsall Robert E and Birdsall Mary
Bought by
Birdsall Robert E
Current Estimated Value
Home Financials for this Owner
Home Financials are based on the most recent Mortgage that was taken out on this home.
Original Mortgage
$71,000
Interest Rate
5.48%
Purchase Details
Closed on
Nov 7, 1997
Sold by
Housing Secretary Of & Urban D
Bought by
Birdsall Robert
Purchase Details
Closed on
Jul 2, 1997
Create a Home Valuation Report for This Property
The Home Valuation Report is an in-depth analysis detailing your home's value as well as a comparison with similar homes in the area
Home Values in the Area
Average Home Value in this Area
Purchase History
| Date | Buyer | Sale Price | Title Company |
|---|---|---|---|
| Birdsall Robert E | -- | None Available | |
| Birdsall Robert | -- | -- | |
| -- | -- | -- |
Source: Public Records
Mortgage History
| Date | Status | Borrower | Loan Amount |
|---|---|---|---|
| Closed | Birdsall Robert E | $71,000 |
Source: Public Records
Tax History
| Year | Tax Paid | Tax Assessment Tax Assessment Total Assessment is a certain percentage of the fair market value that is determined by local assessors to be the total taxable value of land and additions on the property. | Land | Improvement |
|---|---|---|---|---|
| 2024 | $4,228 | $90,000 | $22,500 | $67,500 |
| 2023 | $4,097 | $90,000 | $22,500 | $67,500 |
| 2022 | $4,012 | $90,000 | $22,500 | $67,500 |
| 2021 | $3,959 | $90,000 | $22,500 | $67,500 |
| 2020 | $3,357 | $90,000 | $22,500 | $67,500 |
| 2019 | $1,891 | $90,000 | $22,500 | $67,500 |
| 2018 | $3,238 | $90,000 | $22,500 | $67,500 |
| 2017 | $0 | $90,000 | $22,500 | $67,500 |
| 2016 | $3,177 | $90,000 | $22,500 | $67,500 |
| 2015 | -- | $90,000 | $22,500 | $67,500 |
| 2014 | -- | $90,000 | $22,500 | $67,500 |
Source: Public Records
Map
Nearby Homes
- 76 Tamarack Ln
- 331 Vly Rd
- 20 Hampshire Way
- 11 Gabby Ct
- 227 Shaker Ridge Dr
- 12 Gaslight Dr
- 30 Priddle Ln
- 73 Ashtree Ln
- 388 Vly Rd
- 4 Kings Mill Ct
- 605 Vly Pointe Dr
- 7 Theresa Ann Ct
- 2965 Hillcrest Rd
- 607 Vly Pointe Dr
- 59 New Shaker Rd
- 35 Cole Ave
- 1995 Central Avenue Unit: Suite 5
- 5 Priddle Ln
- 46 Consaul Rd
- 77 Bridle Path