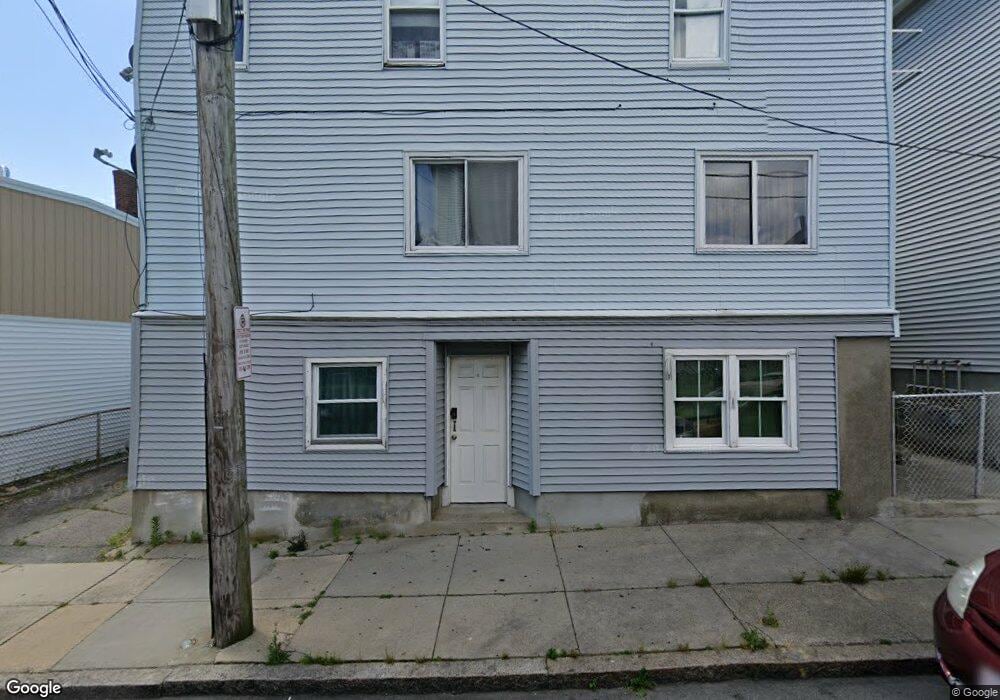
14 Davis St Fall River, MA 02720
Oak Grove Village NeighborhoodEstimated Value: $426,865 - $668,000
8
Beds
4
Baths
3,714
Sq Ft
$156/Sq Ft
Est. Value
About This Home
This home is located at 14 Davis St, Fall River, MA 02720 and is currently estimated at $578,216, approximately $155 per square foot. 14 Davis St is a home located in Bristol County with nearby schools including Mary Fonseca Elementary School, Talbot Innovation School, and B M C Durfee High School.
Ownership History
Date
Name
Owned For
Owner Type
Purchase Details
Closed on
Aug 10, 2015
Sold by
Carreiro Dorvalino S and Carreiro Maria L
Bought by
Maria L Carreiro T
Current Estimated Value
Purchase Details
Closed on
Jul 29, 2005
Sold by
Cabral Lucia and Cabral Todd R
Bought by
Sousa Antonio M
Home Financials for this Owner
Home Financials are based on the most recent Mortgage that was taken out on this home.
Original Mortgage
$190,000
Interest Rate
5.67%
Mortgage Type
Purchase Money Mortgage
Purchase Details
Closed on
Jul 13, 2001
Sold by
Fitzpatrick Michael J and Fitzpatrick Darlene M
Bought by
Cabral Timothy
Purchase Details
Closed on
Feb 18, 2000
Sold by
Dealmeida Maneul and Dealmeida Virgina L
Bought by
Cabral Todd R and Cabral Lucia
Home Financials for this Owner
Home Financials are based on the most recent Mortgage that was taken out on this home.
Original Mortgage
$81,329
Interest Rate
8.11%
Mortgage Type
Commercial
Create a Home Valuation Report for This Property
The Home Valuation Report is an in-depth analysis detailing your home's value as well as a comparison with similar homes in the area
Home Values in the Area
Average Home Value in this Area
Purchase History
| Date | Buyer | Sale Price | Title Company |
|---|---|---|---|
| Maria L Carreiro T | -- | -- | |
| Sousa Antonio M | $237,500 | -- | |
| Cabral Timothy | $30,000 | -- | |
| Cabral Todd R | $82,000 | -- |
Source: Public Records
Mortgage History
| Date | Status | Borrower | Loan Amount |
|---|---|---|---|
| Previous Owner | Sousa Antonio M | $190,000 | |
| Previous Owner | Cabral Todd R | $186,900 | |
| Previous Owner | Cabral Todd R | $153,750 | |
| Previous Owner | Cabral Todd R | $113,250 | |
| Previous Owner | Cabral Todd R | $81,329 |
Source: Public Records
Tax History Compared to Growth
Tax History
| Year | Tax Paid | Tax Assessment Tax Assessment Total Assessment is a certain percentage of the fair market value that is determined by local assessors to be the total taxable value of land and additions on the property. | Land | Improvement |
|---|---|---|---|---|
| 2025 | $5,439 | $475,000 | $104,800 | $370,200 |
| 2024 | $5,204 | $452,900 | $100,900 | $352,000 |
| 2023 | $4,591 | $374,200 | $83,400 | $290,800 |
| 2022 | $4,074 | $322,800 | $79,400 | $243,400 |
| 2021 | $3,850 | $278,400 | $75,600 | $202,800 |
| 2020 | $3,461 | $239,500 | $74,500 | $165,000 |
| 2019 | $2,950 | $202,300 | $71,700 | $130,600 |
| 2018 | $2,845 | $194,600 | $77,700 | $116,900 |
| 2017 | $2,673 | $190,900 | $74,000 | $116,900 |
| 2016 | $2,627 | $192,700 | $78,800 | $113,900 |
| 2015 | $2,521 | $192,700 | $78,800 | $113,900 |
| 2014 | $2,534 | $201,400 | $76,400 | $125,000 |
Source: Public Records
Map
Nearby Homes
- 33 Plain St
- 64 Tremont St
- 90 Tremont St
- 120 15th St Unit 5
- 108 16th St
- 138 18th St
- 992 Pine St
- 218 Plain St
- 243 Robeson St Unit 6
- 243 Robeson St Unit 3
- 884 Cherry St
- 273 Tremont St
- 847 Locust St
- 862 Locust St
- 171 Ogrady St Unit 303 aka 26
- 163 Linden St
- 770 Locust St
- 464 Bank St Unit 10
- 808 Walnut St
- 89 Oak St
- 14 Davis St Unit 3w
- 688 Bedford St
- 670 Bedford St
- 670 Bedford St Unit 2
- 672 Bedford St Unit 1
- 672 Bedford St
- 662 Bedford St
- 700 Bedford St
- 656 Bedford St
- 714 Bedford St Unit 2N
- 31 Orange St
- 652 Bedford St
- 673 Bedford St
- 43 Davis St Unit 3
- 43 Davis St Unit 1
- 41 Orange St Unit 3
- 41 Orange St
- 699 Bedford St
- 56 Davis St
- 732 Bedford St