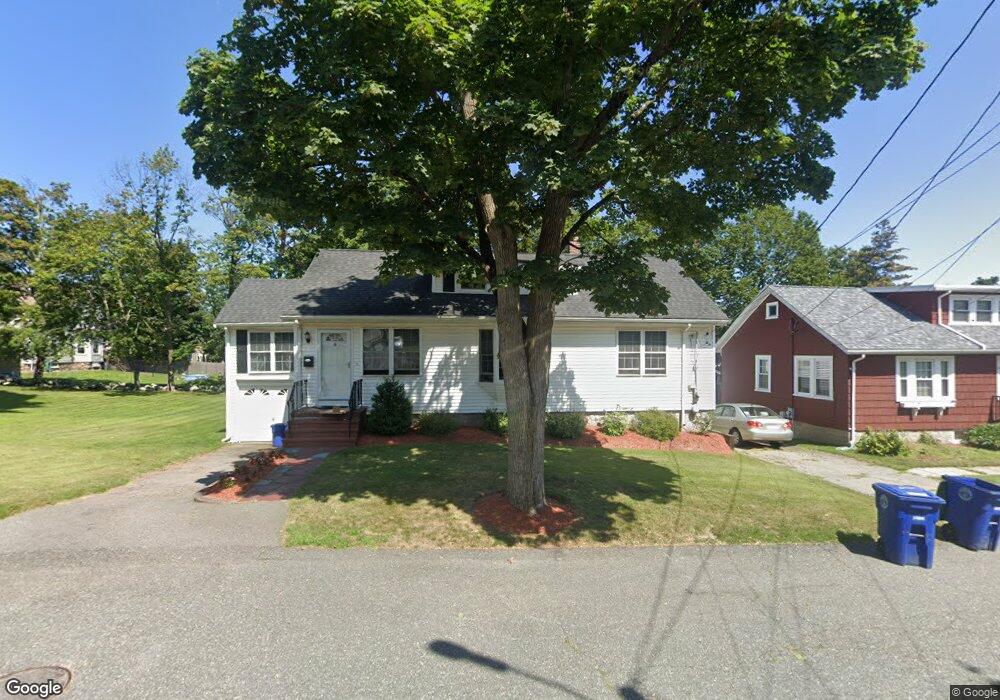
14 Devon Rd Braintree, MA 02184
East Braintree NeighborhoodEstimated Value: $617,000 - $710,000
3
Beds
1
Bath
1,222
Sq Ft
$538/Sq Ft
Est. Value
About This Home
This home is located at 14 Devon Rd, Braintree, MA 02184 and is currently estimated at $656,883, approximately $537 per square foot. 14 Devon Rd is a home located in Norfolk County with nearby schools including Braintree High School, Step Ahead Kindergarten, and Meeting House Montessori School.
Ownership History
Date
Name
Owned For
Owner Type
Purchase Details
Closed on
Jul 17, 2006
Sold by
Omalley John M
Bought by
Omalley Dawn M and Omalley John M
Current Estimated Value
Purchase Details
Closed on
Apr 4, 1996
Sold by
Giallonardo Anthony and Giallonardo Anthony
Bought by
Omalley John M and Omalley Maureen J
Create a Home Valuation Report for This Property
The Home Valuation Report is an in-depth analysis detailing your home's value as well as a comparison with similar homes in the area
Home Values in the Area
Average Home Value in this Area
Purchase History
| Date | Buyer | Sale Price | Title Company |
|---|---|---|---|
| Omalley Dawn M | -- | -- | |
| Omalley Dawn M | -- | -- | |
| Omalley Dawn M | -- | -- | |
| Omalley John M | $55,000 | -- |
Source: Public Records
Mortgage History
| Date | Status | Borrower | Loan Amount |
|---|---|---|---|
| Open | Omalley John M | $40,000 | |
| Open | Omalley John M | $220,000 |
Source: Public Records
Tax History
| Year | Tax Paid | Tax Assessment Tax Assessment Total Assessment is a certain percentage of the fair market value that is determined by local assessors to be the total taxable value of land and additions on the property. | Land | Improvement |
|---|---|---|---|---|
| 2025 | $5,925 | $593,700 | $396,800 | $196,900 |
| 2024 | $5,375 | $567,000 | $372,000 | $195,000 |
| 2023 | $5,035 | $515,900 | $327,400 | $188,500 |
| 2022 | $4,837 | $486,100 | $297,600 | $188,500 |
| 2021 | $4,113 | $413,400 | $251,000 | $162,400 |
| 2020 | $4,012 | $406,900 | $251,000 | $155,900 |
| 2019 | $3,905 | $387,000 | $251,000 | $136,000 |
| 2018 | $3,678 | $349,000 | $218,200 | $130,800 |
| 2017 | $3,536 | $329,200 | $198,400 | $130,800 |
| 2016 | $3,305 | $301,000 | $178,600 | $122,400 |
| 2015 | $3,237 | $292,400 | $174,600 | $117,800 |
| 2014 | $3,180 | $278,500 | $160,700 | $117,800 |
Source: Public Records
Map
Nearby Homes
- 74 Magnolia St
- 17 White Rd
- 141 Hobart St
- 50 Cleveland Ave
- 583 Union St
- 10 Skyline Dr Unit 5
- 30 Skyline Dr Unit 6
- 312 Shaw St
- 36 Chestnut Ave
- 9 Berwick St
- 9 Independence Ave Unit 307
- 25 W Howard St Unit C3
- 25 W Howard St Unit D2
- 125 Allen St Unit A
- 97 Liberty St
- 26 Sun Valley Dr
- 192 Federal Ave Unit B
- 51 Faxon St
- 124 Louise Rd
- 491 Washington St Unit 1