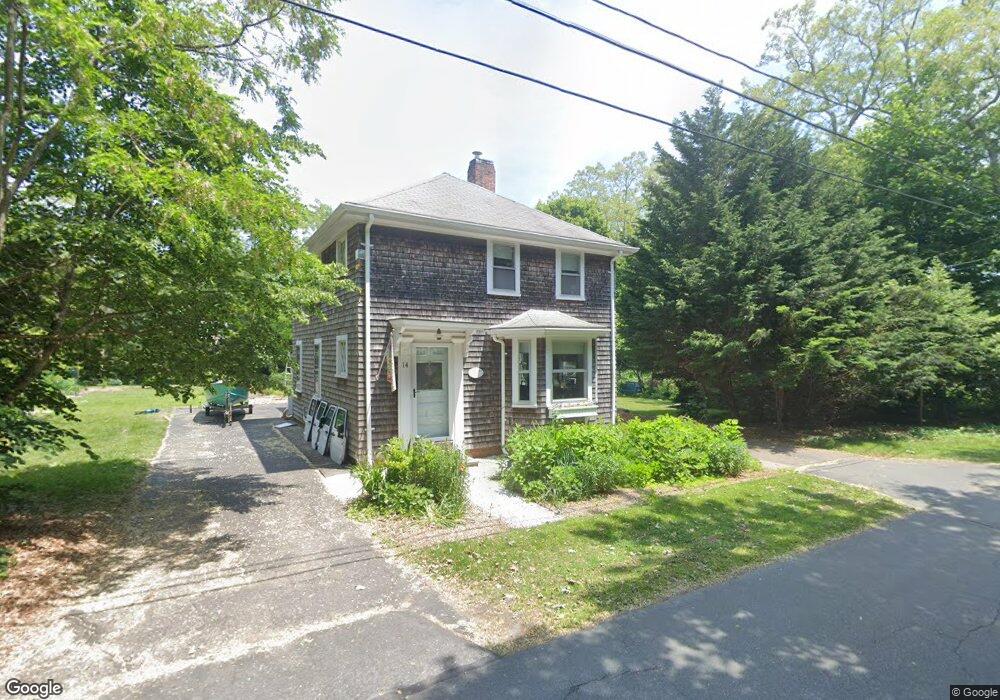
14 Dewey Ave Unit 14 Sandwich, MA 02563
Estimated Value: $727,000 - $955,000
3
Beds
2
Baths
1,704
Sq Ft
$501/Sq Ft
Est. Value
About This Home
This home is located at 14 Dewey Ave Unit 14, Sandwich, MA 02563 and is currently estimated at $854,131, approximately $501 per square foot. 14 Dewey Ave Unit 14 is a home located in Barnstable County with nearby schools including Sandwich Middle High School, Waldorf School of Cape Cod, and Bridgeview Montessori School.
Ownership History
Date
Name
Owned For
Owner Type
Purchase Details
Closed on
Jul 3, 2019
Sold by
Schwartz Martha
Bought by
West Susan E
Current Estimated Value
Home Financials for this Owner
Home Financials are based on the most recent Mortgage that was taken out on this home.
Original Mortgage
$275,000
Outstanding Balance
$241,809
Interest Rate
4%
Mortgage Type
New Conventional
Estimated Equity
$612,322
Purchase Details
Closed on
Aug 17, 1998
Sold by
Katherine Eldredge Ret
Bought by
Schwartz Martha
Home Financials for this Owner
Home Financials are based on the most recent Mortgage that was taken out on this home.
Original Mortgage
$128,000
Interest Rate
6.94%
Mortgage Type
Purchase Money Mortgage
Purchase Details
Closed on
Nov 22, 1996
Sold by
Christian Science
Bought by
Solomon-Schwartz Ann
Purchase Details
Closed on
Oct 29, 1996
Sold by
Katherine Eldridge Ret
Bought by
Solomon-Schwartz Ann
Create a Home Valuation Report for This Property
The Home Valuation Report is an in-depth analysis detailing your home's value as well as a comparison with similar homes in the area
Home Values in the Area
Average Home Value in this Area
Purchase History
| Date | Buyer | Sale Price | Title Company |
|---|---|---|---|
| West Susan E | $344,500 | -- | |
| Schwartz Martha | $160,000 | -- | |
| Solomon-Schwartz Ann | $90,000 | -- | |
| Solomon-Schwartz Ann | $90,000 | -- |
Source: Public Records
Mortgage History
| Date | Status | Borrower | Loan Amount |
|---|---|---|---|
| Open | West Susan E | $275,000 | |
| Previous Owner | Solomon-Schwartz Ann | $122,300 | |
| Previous Owner | Solomon-Schwartz Ann | $128,000 | |
| Previous Owner | Solomon-Schwartz Ann | $150,000 |
Source: Public Records
Tax History Compared to Growth
Tax History
| Year | Tax Paid | Tax Assessment Tax Assessment Total Assessment is a certain percentage of the fair market value that is determined by local assessors to be the total taxable value of land and additions on the property. | Land | Improvement |
|---|---|---|---|---|
| 2025 | $7,506 | $710,100 | $426,700 | $283,400 |
| 2024 | $7,260 | $672,200 | $381,000 | $291,200 |
| 2023 | $6,078 | $528,500 | $263,300 | $265,200 |
| 2022 | $5,700 | $433,100 | $210,300 | $222,800 |
| 2021 | $5,518 | $400,700 | $202,200 | $198,500 |
| 2020 | $5,770 | $403,200 | $214,900 | $188,300 |
| 2019 | $5,552 | $387,700 | $211,000 | $176,700 |
| 2018 | $6,018 | $368,300 | $203,800 | $164,500 |
| 2017 | $5,457 | $365,500 | $223,800 | $141,700 |
| 2016 | $5,125 | $354,200 | $216,300 | $137,900 |
| 2015 | $4,895 | $330,300 | $194,800 | $135,500 |
Source: Public Records
Map
Nearby Homes
- 43 Jarves St
- 19 Willow St
- 5 Canary St
- 32 Church St
- 0 Ox Pasture Rd
- 1 Ox Pasture Rd
- 132 Main St
- 54 Carman Ave
- 114 Tupper Rd Unit 4B
- 114 Tupper Rd Unit 4B
- 1 Swann Hill Ln
- 59 Tupper Ave
- 118 Main St
- 21 Great Island Rd
- 33 Dexter Ave
- 5 White Cap Path Unit 5
- 1-3 White Cap Path Unit 1&3
- 7 Mary Leal Ln
- 27 Moody Dr
- 14 Dewey Ave
- 6 George's Rock
- 0 George's Rock
- 10 Dewey Ave
- 7 Dewey Ave
- 2A Georges Rock Rd
- 2 Georges Rock Rd
- 9 Dewey Ave
- 16 Dewey Ave
- 5 Dewey Ave
- 6-A Georges Rock Rd
- 3 Georges Rock Rd
- 6A Georges Rock Rd
- 6 Georges Rock Rd
- 0 Dewey Ave
- 8 Dewey Ave
- 0 Georges Rock Rd
- 18 Dewey Ave
- 18 Dewey Ave Unit 18A
- 7 Georges Rock Rd