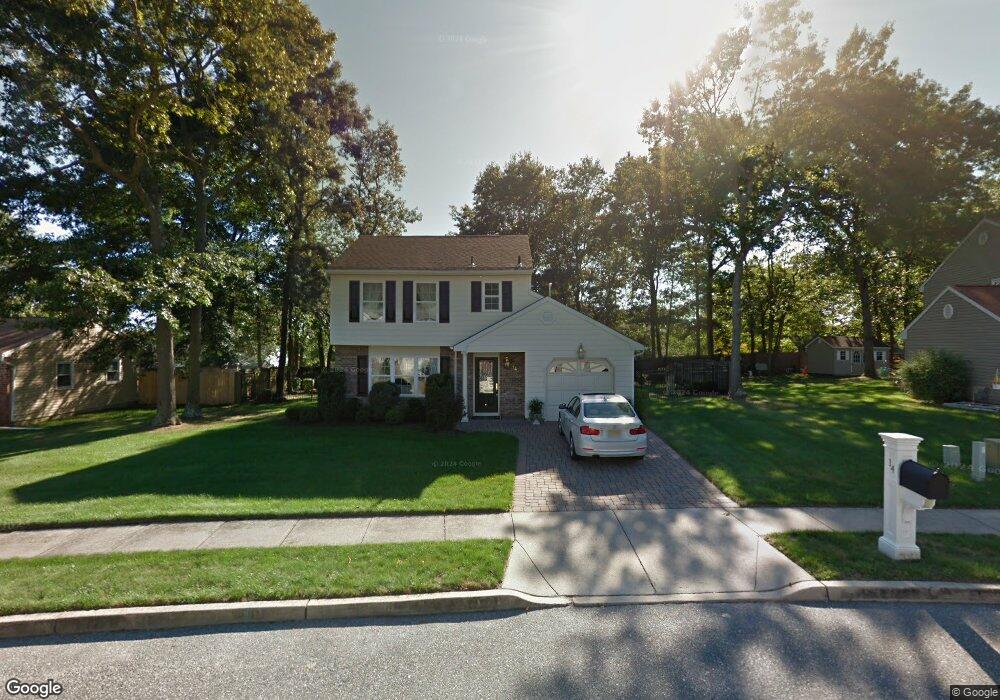
14 Digger St Howell, NJ 07731
Ramtown NeighborhoodEstimated Value: $371,881
3
Beds
2
Baths
1,200
Sq Ft
$310/Sq Ft
Est. Value
About This Home
This home is located at 14 Digger St, Howell, NJ 07731 and is currently estimated at $371,881, approximately $309 per square foot. 14 Digger St is a home located in Monmouth County with nearby schools including Ramtown School, Greenville School, and Howell Township Middle School South.
Ownership History
Date
Name
Owned For
Owner Type
Purchase Details
Closed on
Aug 18, 2023
Sold by
Cooper Pauline A
Bought by
Cooper Ross L and Cooper Pauline A
Current Estimated Value
Purchase Details
Closed on
Jul 10, 2009
Sold by
Cooper Pauline A and Zadie Pauline A
Bought by
Cooper Pauline A
Purchase Details
Closed on
Nov 7, 2005
Sold by
Mancino Phyllis
Bought by
Za Penny A Zadie Aka Pauline A
Purchase Details
Closed on
Oct 3, 2000
Sold by
Zadie Joseph
Bought by
Mancino Phyllis
Create a Home Valuation Report for This Property
The Home Valuation Report is an in-depth analysis detailing your home's value as well as a comparison with similar homes in the area
Home Values in the Area
Average Home Value in this Area
Purchase History
| Date | Buyer | Sale Price | Title Company |
|---|---|---|---|
| Cooper Ross L | -- | None Listed On Document | |
| Cooper Pauline A | -- | None Available | |
| Za Penny A Zadie Aka Pauline A | -- | -- | |
| Mancino Phyllis | $105,000 | -- |
Source: Public Records
Tax History
| Year | Tax Paid | Tax Assessment Tax Assessment Total Assessment is a certain percentage of the fair market value that is determined by local assessors to be the total taxable value of land and additions on the property. | Land | Improvement |
|---|---|---|---|---|
| 2025 | $7,594 | $476,400 | $330,500 | $145,900 |
| 2024 | $7,629 | $428,800 | $285,500 | $143,300 |
Source: Public Records
Map
Nearby Homes
- 28 Jacob Dr
- 40 Pinyon St
- 9 Ivy Place
- 18 Rutgers Dr
- 4 Pine Cone Ln
- 174 Ramtown Greenville Rd
- 39 Oak Terrace
- 51 Alan Terrace
- 24 Little Leaf Ln
- 60 Sunset Dr
- 1150 Rita Ct
- 35 Vivian Ct
- 457 Newtons Corner Rd
- 19 Virginia Dr
- 38 Amy Ct Unit 1301
- 538 Linda Ct
- 131 Briar Mills Dr
- 28 Bronia St
- 37 Amy Ct
- 506 Linda Ct Unit 47H
Your Personal Tour Guide
Ask me questions while you tour the home.