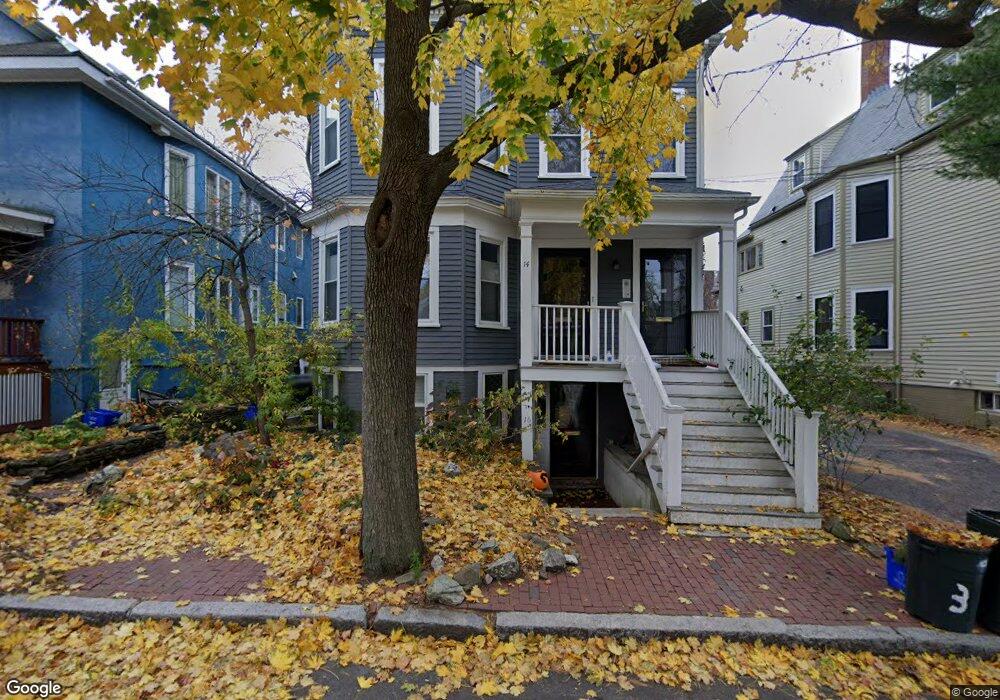
14 Ellsworth Park Unit 16 Cambridge, MA 02139
Mid-Cambridge NeighborhoodEstimated Value: $1,082,969 - $1,259,000
2
Beds
2
Baths
1,128
Sq Ft
$1,034/Sq Ft
Est. Value
About This Home
This home is located at 14 Ellsworth Park Unit 16, Cambridge, MA 02139 and is currently estimated at $1,166,242, approximately $1,033 per square foot. 14 Ellsworth Park Unit 16 is a home located in Middlesex County with nearby schools including Saint Paul's Choir School.
Ownership History
Date
Name
Owned For
Owner Type
Purchase Details
Closed on
Jun 30, 2022
Sold by
Druzba-Lobsenz Irena and Lobsenz Allan C
Bought by
Durand Louise A
Current Estimated Value
Purchase Details
Closed on
Feb 27, 1998
Sold by
Kennedy John R
Bought by
Chen Katy and Zumbrunn Allice Y
Home Financials for this Owner
Home Financials are based on the most recent Mortgage that was taken out on this home.
Original Mortgage
$260,000
Interest Rate
6.85%
Mortgage Type
Purchase Money Mortgage
Create a Home Valuation Report for This Property
The Home Valuation Report is an in-depth analysis detailing your home's value as well as a comparison with similar homes in the area
Home Values in the Area
Average Home Value in this Area
Purchase History
| Date | Buyer | Sale Price | Title Company |
|---|---|---|---|
| Durand Louise A | $1,121,000 | None Available | |
| Durand Louise A | $1,121,000 | None Available | |
| Chen Katy | $325,000 | -- | |
| Chen Katy | $325,000 | -- |
Source: Public Records
Mortgage History
| Date | Status | Borrower | Loan Amount |
|---|---|---|---|
| Previous Owner | Chen Katy | $260,000 |
Source: Public Records
Tax History Compared to Growth
Tax History
| Year | Tax Paid | Tax Assessment Tax Assessment Total Assessment is a certain percentage of the fair market value that is determined by local assessors to be the total taxable value of land and additions on the property. | Land | Improvement |
|---|---|---|---|---|
| 2025 | $5,980 | $941,800 | $0 | $941,800 |
| 2024 | $5,466 | $923,300 | $0 | $923,300 |
| 2023 | $5,210 | $889,100 | $0 | $889,100 |
| 2022 | $5,189 | $876,600 | $0 | $876,600 |
| 2021 | $5,079 | $868,200 | $0 | $868,200 |
| 2020 | $4,830 | $840,000 | $0 | $840,000 |
| 2019 | $4,628 | $779,100 | $0 | $779,100 |
| 2018 | $2,415 | $714,700 | $0 | $714,700 |
| 2017 | $4,304 | $663,200 | $0 | $663,200 |
| 2016 | $4,156 | $594,600 | $0 | $594,600 |
| 2015 | $4,117 | $526,500 | $0 | $526,500 |
| 2014 | $3,939 | $470,100 | $0 | $470,100 |
Source: Public Records
Map
Nearby Homes
- 395 Broadway Unit L5B
- 74-76 Dana St Unit 2
- 2 Crawford St Unit 7
- 8 Chatham St Unit 4
- 329 Harvard St Unit 1
- 54 Ellery St Unit 3
- 17 Marie Ave Unit 3
- 345 Harvard St Unit 1F
- 338 Harvard St Unit 10
- 58 Trowbridge St Unit 2
- 12 Fainwood Cir Unit 2
- 10 Dana St Unit 202
- 11 Dana St Unit D
- 5 Centre St Unit 32
- 75 Fayette St Unit 3
- 67 Inman St
- 15 Ellery St Unit 12
- 285 Harvard St Unit 408
- 1431 Cambridge St Unit 1
- 107 1/2 Inman St Unit 1
- 14 Ellsworth Park Unit 16
- 14 Ellsworth Park Unit 16
- 14 Ellsworth Park Unit G
- 14 Ellsworth Park Unit 3
- 16 Ellsworth Park Unit 16
- 18 Ellsworth Park
- 2 Ellsworth Park
- 2 Ellsworth Park Unit 2
- 33 Highland Ave
- 31 Highland Ave
- 37 Highland Ave
- 35 Highland Ave Unit 35
- 37 Highland Ave Unit 3
- 37 Highland Ave Unit 42
- 37 Highland Ave Unit 1
- 35 Highland Ave
- 35 Highland Ave Unit 1
- 35 Highland Ave
- 17 Ellsworth Park
- 17 Ellsworth Park Unit 1