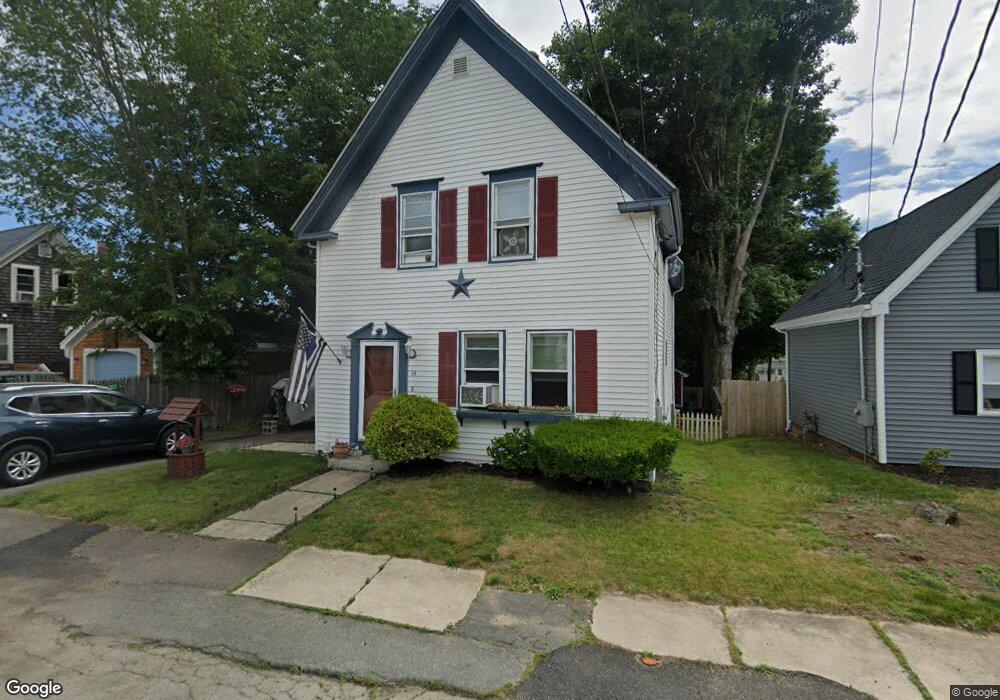
14 Erin St Whitman, MA 02382
Estimated Value: $494,273 - $534,000
4
Beds
2
Baths
1,348
Sq Ft
$383/Sq Ft
Est. Value
About This Home
This home is located at 14 Erin St, Whitman, MA 02382 and is currently estimated at $515,818, approximately $382 per square foot. 14 Erin St is a home located in Plymouth County with nearby schools including St Bridget School.
Ownership History
Date
Name
Owned For
Owner Type
Purchase Details
Closed on
Dec 8, 1995
Sold by
Nolan Mary L
Bought by
Belcher Edward F and Belcher Barbara J
Current Estimated Value
Home Financials for this Owner
Home Financials are based on the most recent Mortgage that was taken out on this home.
Original Mortgage
$120,450
Interest Rate
7.44%
Mortgage Type
Purchase Money Mortgage
Purchase Details
Closed on
Jan 23, 1995
Sold by
Department Of Housing & Urban Dev
Bought by
Nolan Mary L
Home Financials for this Owner
Home Financials are based on the most recent Mortgage that was taken out on this home.
Original Mortgage
$77,250
Interest Rate
9.16%
Mortgage Type
Purchase Money Mortgage
Purchase Details
Closed on
Nov 22, 1993
Sold by
Managhan James L
Bought by
Usa Secy Hous & Urb Dv
Create a Home Valuation Report for This Property
The Home Valuation Report is an in-depth analysis detailing your home's value as well as a comparison with similar homes in the area
Home Values in the Area
Average Home Value in this Area
Purchase History
| Date | Buyer | Sale Price | Title Company |
|---|---|---|---|
| Belcher Edward F | $122,000 | -- | |
| Nolan Mary L | $53,000 | -- | |
| Usa Secy Hous & Urb Dv | $70,500 | -- |
Source: Public Records
Mortgage History
| Date | Status | Borrower | Loan Amount |
|---|---|---|---|
| Open | Usa Secy Hous & Urb Dv | $164,000 | |
| Closed | Usa Secy Hous & Urb Dv | $151,400 | |
| Closed | Usa Secy Hous & Urb Dv | $120,450 | |
| Previous Owner | Usa Secy Hous & Urb Dv | $77,250 |
Source: Public Records
Tax History
| Year | Tax Paid | Tax Assessment Tax Assessment Total Assessment is a certain percentage of the fair market value that is determined by local assessors to be the total taxable value of land and additions on the property. | Land | Improvement |
|---|---|---|---|---|
| 2025 | $5,405 | $412,000 | $197,900 | $214,100 |
| 2024 | $5,102 | $400,500 | $194,100 | $206,400 |
| 2023 | $4,874 | $359,200 | $168,300 | $190,900 |
| 2022 | $4,805 | $330,000 | $153,000 | $177,000 |
| 2021 | $4,621 | $298,100 | $140,600 | $157,500 |
| 2020 | $4,425 | $279,200 | $127,200 | $152,000 |
| 2019 | $4,165 | $270,800 | $127,200 | $143,600 |
| 2018 | $3,873 | $241,900 | $120,500 | $121,400 |
| 2017 | $3,648 | $241,900 | $120,500 | $121,400 |
| 2016 | $3,531 | $226,500 | $114,700 | $111,800 |
| 2015 | $3,578 | $229,200 | $114,700 | $114,500 |
Source: Public Records
Map
Nearby Homes
Your Personal Tour Guide
Ask me questions while you tour the home.