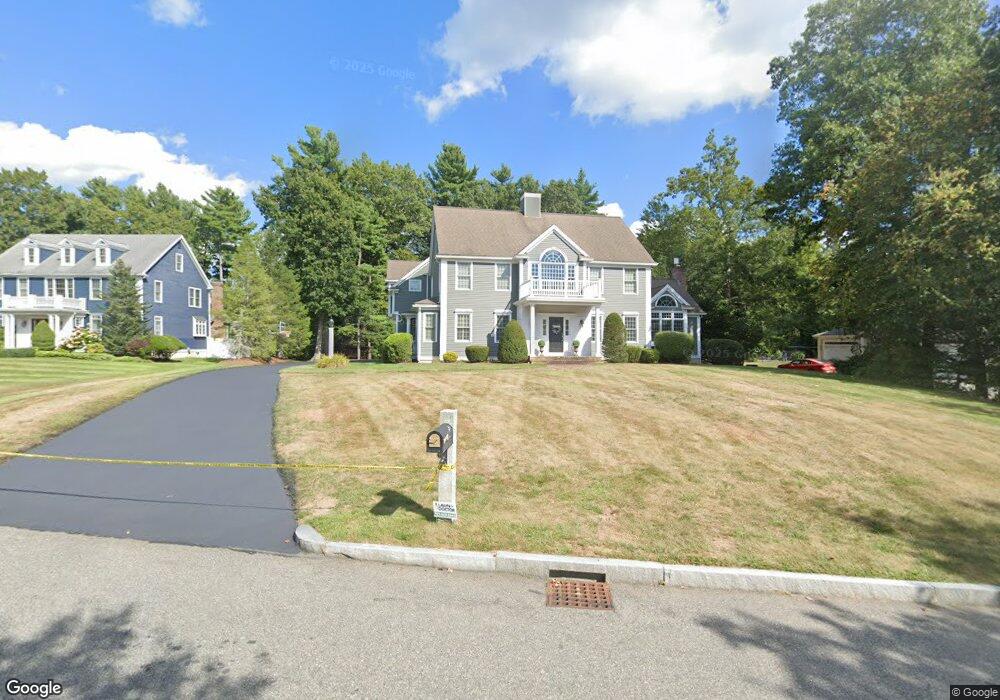
14 Forest St Hanover, MA 02339
Estimated Value: $1,347,875 - $1,549,000
4
Beds
3
Baths
3,769
Sq Ft
$385/Sq Ft
Est. Value
About This Home
This home is located at 14 Forest St, Hanover, MA 02339 and is currently estimated at $1,450,219, approximately $384 per square foot. 14 Forest St is a home located in Plymouth County with nearby schools including Hanover High School, South Shore Charter Public School, and Holy Family Elementary School.
Ownership History
Date
Name
Owned For
Owner Type
Purchase Details
Closed on
Nov 21, 2013
Sold by
Nee Patrick J and Nee Patricia A
Bought by
Patrick Nee Lt and Nee
Current Estimated Value
Purchase Details
Closed on
Sep 22, 2003
Sold by
Ocean Rt and Obrien
Bought by
Nee Patrick J and Nee Patricia A
Create a Home Valuation Report for This Property
The Home Valuation Report is an in-depth analysis detailing your home's value as well as a comparison with similar homes in the area
Home Values in the Area
Average Home Value in this Area
Purchase History
| Date | Buyer | Sale Price | Title Company |
|---|---|---|---|
| Patrick Nee Lt | -- | -- | |
| Patrick Nee Lt | -- | -- | |
| Nee Patrick J | $875,000 | -- | |
| Nee Patrick J | $875,000 | -- |
Source: Public Records
Mortgage History
| Date | Status | Borrower | Loan Amount |
|---|---|---|---|
| Previous Owner | Nee Patrick J | $150,000 | |
| Previous Owner | Nee Patrick J | $296,000 | |
| Previous Owner | Nee Patrick J | $300,000 |
Source: Public Records
Tax History
| Year | Tax Paid | Tax Assessment Tax Assessment Total Assessment is a certain percentage of the fair market value that is determined by local assessors to be the total taxable value of land and additions on the property. | Land | Improvement |
|---|---|---|---|---|
| 2025 | $15,625 | $1,265,200 | $336,700 | $928,500 |
| 2024 | $15,177 | $1,182,000 | $336,700 | $845,300 |
| 2023 | $15,072 | $1,117,300 | $306,100 | $811,200 |
| 2022 | $15,024 | $985,200 | $269,400 | $715,800 |
| 2021 | $15,015 | $919,500 | $244,800 | $674,700 |
| 2020 | $14,503 | $889,200 | $244,800 | $644,400 |
| 2019 | $14,260 | $869,000 | $267,100 | $601,900 |
| 2018 | $13,157 | $808,200 | $267,100 | $541,100 |
| 2017 | $13,725 | $830,800 | $270,200 | $560,600 |
| 2016 | $13,377 | $793,400 | $245,700 | $547,700 |
| 2015 | $12,813 | $793,400 | $245,700 | $547,700 |
Source: Public Records
Map
Nearby Homes
- 36 Bayberry Ln
- 73 Shingle Mill Ln
- 47 Stone Meadow Ln
- 44 Stone Meadow Ln
- 776 Main St
- 46 Brookwood Rd
- 50 Village Ln
- 535 Webster St
- 18 Winterberry Ln
- 506 Main St
- 206-208 Hinghm St
- 436 E Water St
- 823 Market St
- 53 Chestnut St
- 117 Liberty St
- 9 Old Market St
- 49 Liberty St
- 49 Washington Park Dr
- 5 Blueberry Ct
- 8 Blueberry Ct
Your Personal Tour Guide
Ask me questions while you tour the home.