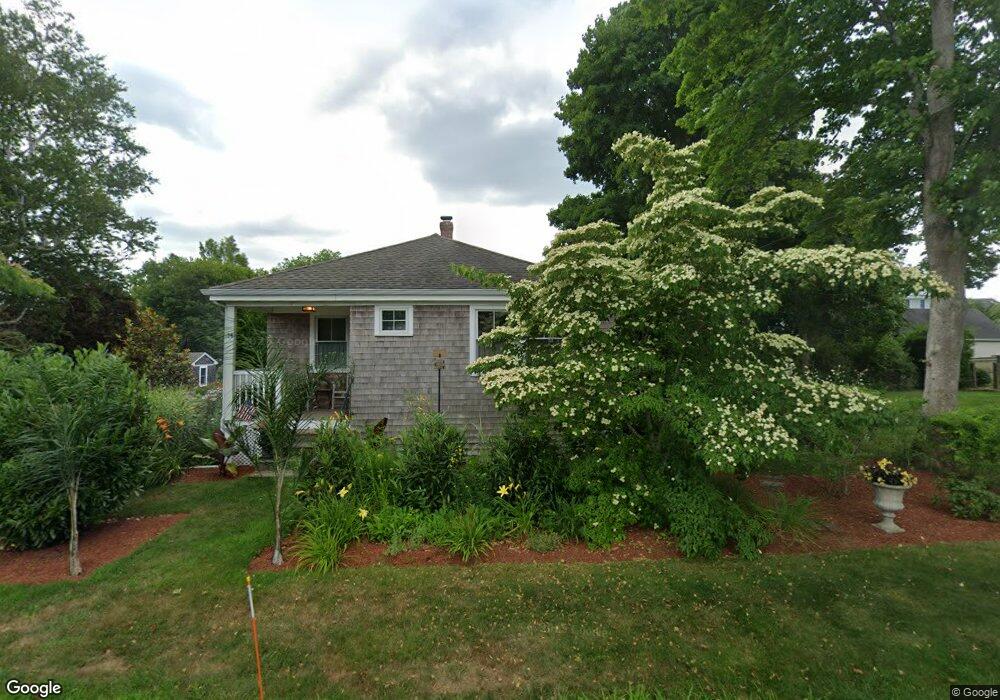
14 Foster St Mattapoisett, MA 02739
Estimated Value: $589,737 - $757,000
2
Beds
1
Bath
1,555
Sq Ft
$436/Sq Ft
Est. Value
About This Home
This home is located at 14 Foster St, Mattapoisett, MA 02739 and is currently estimated at $677,684, approximately $435 per square foot. 14 Foster St is a home located in Plymouth County with nearby schools including Center School, Old Hammondtown Elementary, and Old Rochester Regional High School.
Ownership History
Date
Name
Owned For
Owner Type
Purchase Details
Closed on
Sep 26, 2007
Sold by
Watjen Susan L and Rowland William N
Bought by
Nordquist James A
Current Estimated Value
Home Financials for this Owner
Home Financials are based on the most recent Mortgage that was taken out on this home.
Original Mortgage
$225,000
Interest Rate
6.65%
Mortgage Type
Purchase Money Mortgage
Purchase Details
Closed on
Nov 1, 2004
Sold by
Rowland Ft
Bought by
Rowland Francis C
Create a Home Valuation Report for This Property
The Home Valuation Report is an in-depth analysis detailing your home's value as well as a comparison with similar homes in the area
Home Values in the Area
Average Home Value in this Area
Purchase History
| Date | Buyer | Sale Price | Title Company |
|---|---|---|---|
| Nordquist James A | $450,000 | -- | |
| Nordquist James A | $450,000 | -- | |
| Rowland Francis C | -- | -- | |
| Rowland Francis C | -- | -- |
Source: Public Records
Mortgage History
| Date | Status | Borrower | Loan Amount |
|---|---|---|---|
| Open | Rowland Francis C | $239,000 | |
| Closed | Rowland Francis C | $250,000 | |
| Closed | Rowland Francis C | $225,000 |
Source: Public Records
Tax History Compared to Growth
Tax History
| Year | Tax Paid | Tax Assessment Tax Assessment Total Assessment is a certain percentage of the fair market value that is determined by local assessors to be the total taxable value of land and additions on the property. | Land | Improvement |
|---|---|---|---|---|
| 2025 | $5,292 | $491,800 | $309,500 | $182,300 |
| 2024 | $5,153 | $490,300 | $309,500 | $180,800 |
| 2023 | $4,910 | $436,400 | $276,200 | $160,200 |
| 2022 | $4,842 | $390,500 | $230,300 | $160,200 |
| 2021 | $4,877 | $376,300 | $254,900 | $121,400 |
| 2020 | $4,473 | $331,600 | $219,200 | $112,400 |
| 2019 | $4,421 | $334,700 | $222,300 | $112,400 |
| 2018 | $5,362 | $411,800 | $243,800 | $168,000 |
| 2017 | $4,908 | $375,500 | $229,900 | $145,600 |
| 2016 | $4,957 | $375,500 | $229,900 | $145,600 |
| 2015 | $4,967 | $382,100 | $241,000 | $141,100 |
| 2014 | $4,862 | $382,200 | $243,800 | $138,400 |
Source: Public Records
Map
Nearby Homes
- 15 Ned's Point Rd
- 11 Captains Ln
- 8 Captains Ln
- 18 Pine Island Rd
- 52 Prince Snow Cir
- 35 North St
- 12 Cannon St
- 20 Cannon St
- 4 Beech Tree Ln
- 7 Pearl St
- 13 Hammond St
- 3 Rock St
- 6 Ocean Breeze Ln
- 9 Hitching Post Rd
- 1 Angelica Ave
- 10 Gosnold St
- 13 Park Place
- 31 Split Rock Ln
- 0 Harbor Acres Ln - Lot B
- 1 Starboard Way