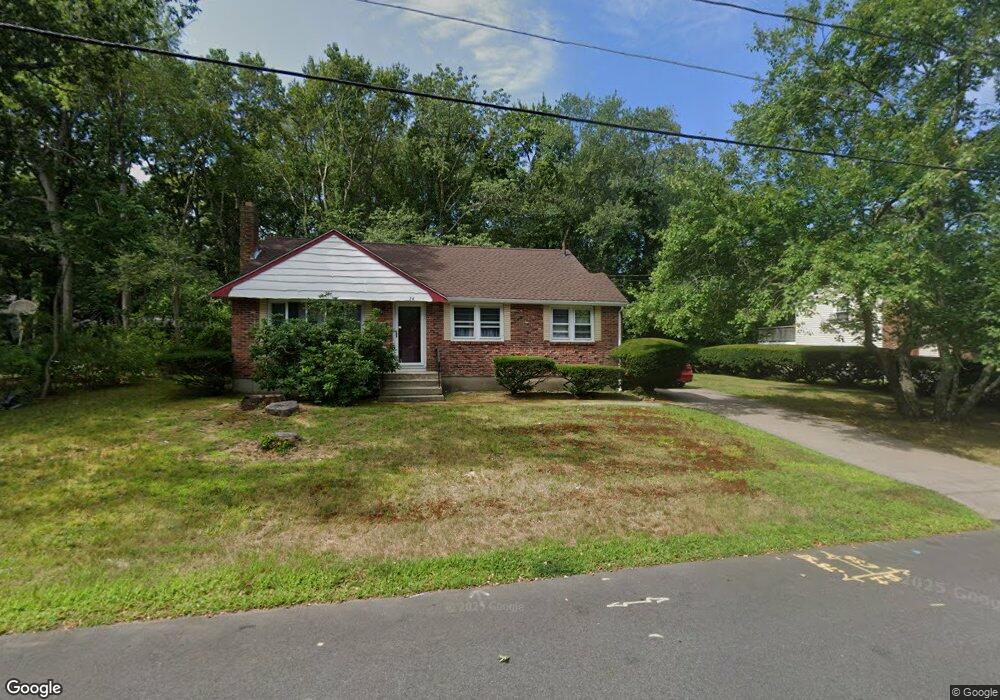
14 Fraser Rd Stoughton, MA 02072
Estimated Value: $526,000 - $618,000
3
Beds
1
Bath
1,464
Sq Ft
$386/Sq Ft
Est. Value
About This Home
This home is located at 14 Fraser Rd, Stoughton, MA 02072 and is currently estimated at $565,650, approximately $386 per square foot. 14 Fraser Rd is a home located in Norfolk County with nearby schools including Joseph R Dawe Jr Elementary School, O'Donnell Middle School, and Stoughton High School.
Ownership History
Date
Name
Owned For
Owner Type
Purchase Details
Closed on
Mar 17, 2016
Sold by
Donovan Robert J and Donovan Carol R
Bought by
Donovan Irt and Donovan
Current Estimated Value
Purchase Details
Closed on
Jun 12, 1974
Bought by
Donovan Robert J and Donovan Carol R
Create a Home Valuation Report for This Property
The Home Valuation Report is an in-depth analysis detailing your home's value as well as a comparison with similar homes in the area
Home Values in the Area
Average Home Value in this Area
Purchase History
| Date | Buyer | Sale Price | Title Company |
|---|---|---|---|
| Donovan Irt | -- | -- | |
| Donovan Irt | -- | -- | |
| Donovan Irt | -- | -- | |
| Donovan Robert J | -- | -- |
Source: Public Records
Mortgage History
| Date | Status | Borrower | Loan Amount |
|---|---|---|---|
| Previous Owner | Donovan Robert J | $90,000 |
Source: Public Records
Tax History
| Year | Tax Paid | Tax Assessment Tax Assessment Total Assessment is a certain percentage of the fair market value that is determined by local assessors to be the total taxable value of land and additions on the property. | Land | Improvement |
|---|---|---|---|---|
| 2025 | $5,869 | $474,100 | $222,200 | $251,900 |
| 2024 | $5,666 | $445,100 | $203,000 | $242,100 |
| 2023 | $5,435 | $401,100 | $185,500 | $215,600 |
| 2022 | $5,418 | $376,000 | $178,500 | $197,500 |
| 2021 | $5,220 | $345,700 | $157,500 | $188,200 |
| 2020 | $5,147 | $345,700 | $157,500 | $188,200 |
| 2019 | $5,059 | $329,800 | $157,500 | $172,300 |
| 2018 | $4,535 | $306,200 | $150,500 | $155,700 |
| 2017 | $4,248 | $293,200 | $148,700 | $144,500 |
| 2016 | $4,129 | $275,800 | $134,700 | $141,100 |
| 2015 | $3,852 | $254,600 | $127,700 | $126,900 |
| 2014 | $3,597 | $228,500 | $117,200 | $111,300 |
Source: Public Records
Map
Nearby Homes
Your Personal Tour Guide
Ask me questions while you tour the home.