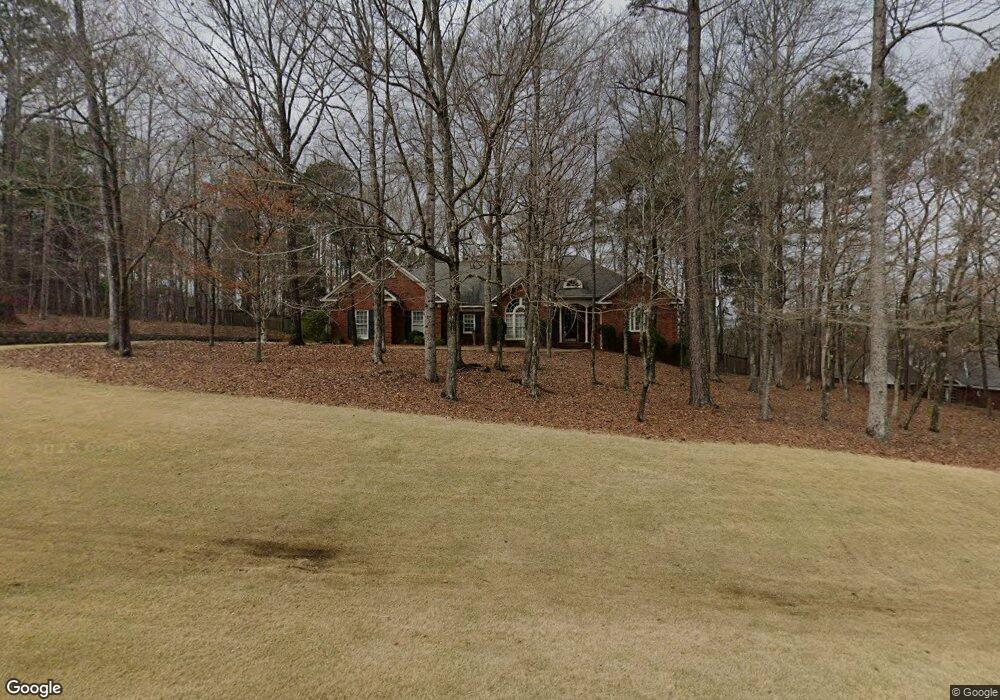
14 Gray Fox Ct Cataula, GA 31804
Estimated Value: $449,314 - $559,000
3
Beds
3
Baths
3,167
Sq Ft
$159/Sq Ft
Est. Value
About This Home
This home is located at 14 Gray Fox Ct, Cataula, GA 31804 and is currently estimated at $503,079, approximately $158 per square foot. 14 Gray Fox Ct is a home located in Harris County with nearby schools including Mulberry Creek Elementary School, Creekside School, and Harris County Carver Middle School.
Ownership History
Date
Name
Owned For
Owner Type
Purchase Details
Closed on
Apr 12, 2018
Sold by
Cox Bruce K
Bought by
Okula Michael and Okula Chong F
Current Estimated Value
Purchase Details
Closed on
Oct 28, 2010
Sold by
Chesher Mike D and Chesher Pamela A
Bought by
Cox Bruce K and Cox Sandra N
Purchase Details
Closed on
Apr 2, 2008
Sold by
Chesher Pamela A
Bought by
Chesher Pamela A
Home Financials for this Owner
Home Financials are based on the most recent Mortgage that was taken out on this home.
Original Mortgage
$268,000
Interest Rate
6.03%
Mortgage Type
New Conventional
Purchase Details
Closed on
Mar 21, 2005
Sold by
Cathey Joyce L
Bought by
Bartholic David Frank
Home Financials for this Owner
Home Financials are based on the most recent Mortgage that was taken out on this home.
Original Mortgage
$260,000
Interest Rate
4.88%
Mortgage Type
New Conventional
Purchase Details
Closed on
Feb 10, 2003
Sold by
Transfereez Real Estate Trust
Bought by
Cathey Joyce L
Purchase Details
Closed on
Dec 7, 1995
Bought by
Anglin David L and Anglin Beth M
Create a Home Valuation Report for This Property
The Home Valuation Report is an in-depth analysis detailing your home's value as well as a comparison with similar homes in the area
Purchase History
| Date | Buyer | Sale Price | Title Company |
|---|---|---|---|
| Okula Michael | $340,000 | -- | |
| Cox Bruce K | $328,100 | -- | |
| Chesher Pamela A | -- | -- | |
| Chesher Pamela A | $335,000 | -- | |
| Bartholic David Frank | $350,000 | -- | |
| Bartholic David Frank | -- | -- | |
| Cathey Joyce L | $263,900 | -- | |
| Transfereez Real Estate Trust | $263,900 | -- | |
| Anglin David L | $260,000 | -- |
Source: Public Records
Mortgage History
| Date | Status | Borrower | Loan Amount |
|---|---|---|---|
| Previous Owner | Chesher Pamela A | $268,000 | |
| Previous Owner | Bartholic David Frank | $260,000 |
Source: Public Records
Tax History
| Year | Tax Paid | Tax Assessment Tax Assessment Total Assessment is a certain percentage of the fair market value that is determined by local assessors to be the total taxable value of land and additions on the property. | Land | Improvement |
|---|---|---|---|---|
| 2025 | $4,040 | $170,544 | $20,400 | $150,144 |
| 2024 | $4,452 | $165,429 | $20,400 | $145,029 |
| 2023 | $3,778 | $140,122 | $20,400 | $119,722 |
| 2022 | $3,778 | $140,122 | $20,400 | $119,722 |
| 2021 | $3,808 | $136,241 | $20,400 | $115,841 |
| 2020 | $3,808 | $136,241 | $20,400 | $115,841 |
| 2019 | $3,666 | $136,241 | $20,400 | $115,841 |
| 2018 | $3,721 | $135,286 | $20,400 | $114,886 |
| 2017 | $3,193 | $115,800 | $20,400 | $95,400 |
| 2016 | $2,917 | $115,949 | $20,400 | $95,549 |
| 2015 | $2,922 | $115,949 | $20,400 | $95,549 |
| 2014 | $2,928 | $115,949 | $20,400 | $95,549 |
| 2013 | -- | $115,949 | $20,400 | $95,549 |
Source: Public Records
Map
Nearby Homes
- 508 Sweetwater Dr
- 509 Sweetwater Dr
- 58 Sweetwater Dr
- 218 E East Bonacre Rd
- 262 Pintail Dr
- 654 Grey Rock Rd
- 172-6 Almond Ridge Dr
- 4555 Mountain Ivy Dr
- 4559 Mountain Ivy Dr
- 654 Grey Rock Dr
- 595 Grey Rock Dr
- 4554 Mountain Ivy Dr
- 4586 Wisteria Ln
- 9214 Granite Field Ct
- 1278 Jones Rd
- 8000 Climbing Ivy Ct
- 9586 English Ivy Ct
- 4557 Ivy Patch Dr
- 3860 Essex Heights Trail
- 492 Mulberry Crossing Dr
- 63 Gray Fox Ct
- 26 Gray Fox Ct
- 3 Gray Fox Ct
- 0 Waterview Ct
- 68 Gray Fox Ct
- 153 Mountain Lake Dr
- 2 Gray Fox Ct
- 42 Waterview Ct
- 107 Waterview Ct
- 156 Mountain Lake Dr
- 125 Gray Fox Ct
- 100 Waterview Ct
- 114 Gray Fox Ct
- 117 Mountain Lake Dr
- 4 Gray Fox Ct
- 139 Gray Fox Ct
- 133 Gray Fox Ct
- 104 Mountain Lake Dr
- 14 Waterfall Way
- 58 Waterfall Way
Your Personal Tour Guide
Ask me questions while you tour the home.