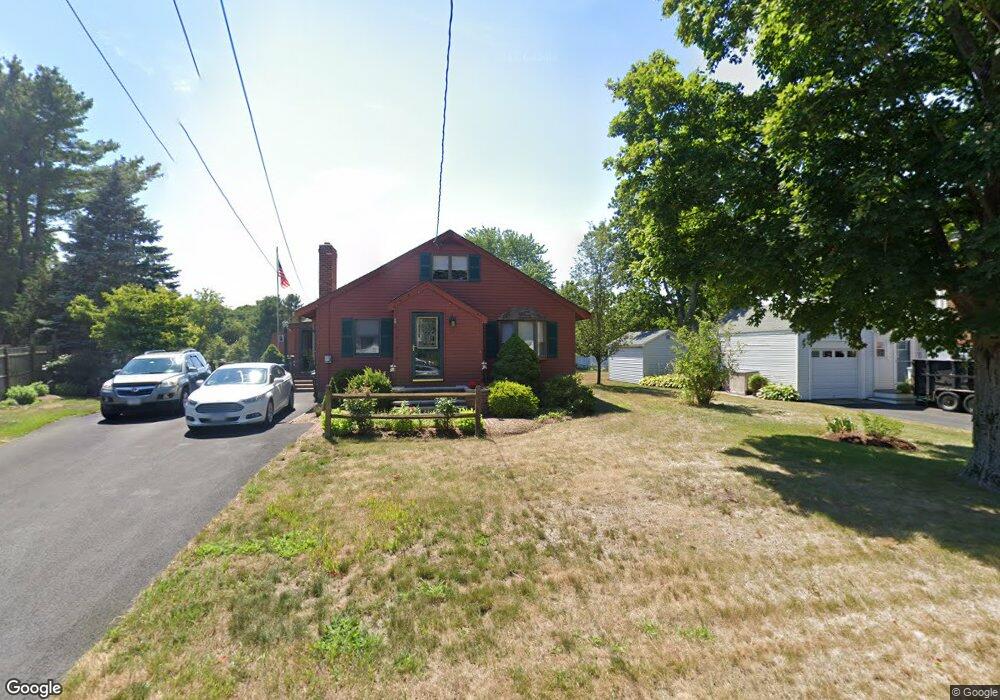
14 Green St Danvers, MA 01923
Estimated Value: $752,161 - $966,000
2
Beds
3
Baths
2,273
Sq Ft
$374/Sq Ft
Est. Value
About This Home
This home is located at 14 Green St, Danvers, MA 01923 and is currently estimated at $849,540, approximately $373 per square foot. 14 Green St is a home located in Essex County with nearby schools including Danvers High School, St. Mary of the Annunciation School, and Plumfield Academy.
Ownership History
Date
Name
Owned For
Owner Type
Purchase Details
Closed on
Apr 28, 2014
Sold by
Welenc Richard W and Welenc Caren M
Bought by
Welenc Ft and Troy
Current Estimated Value
Purchase Details
Closed on
Aug 17, 1976
Bought by
Welenc Richard W and Welenc Caren
Create a Home Valuation Report for This Property
The Home Valuation Report is an in-depth analysis detailing your home's value as well as a comparison with similar homes in the area
Home Values in the Area
Average Home Value in this Area
Purchase History
| Date | Buyer | Sale Price | Title Company |
|---|---|---|---|
| Welenc Ft | -- | -- | |
| Welenc Richard W | -- | -- |
Source: Public Records
Mortgage History
| Date | Status | Borrower | Loan Amount |
|---|---|---|---|
| Previous Owner | Welenc Richard W | $63,000 | |
| Previous Owner | Welenc Richard W | $30,000 | |
| Previous Owner | Welenc Richard W | $48,000 | |
| Previous Owner | Welenc Richard W | $50,000 |
Source: Public Records
Tax History Compared to Growth
Tax History
| Year | Tax Paid | Tax Assessment Tax Assessment Total Assessment is a certain percentage of the fair market value that is determined by local assessors to be the total taxable value of land and additions on the property. | Land | Improvement |
|---|---|---|---|---|
| 2025 | $7,140 | $649,700 | $370,600 | $279,100 |
| 2024 | $7,180 | $646,300 | $370,600 | $275,700 |
| 2023 | $6,890 | $586,400 | $336,800 | $249,600 |
| 2022 | $6,739 | $532,300 | $305,500 | $226,800 |
| 2021 | $6,311 | $472,700 | $289,400 | $183,300 |
| 2020 | $6,231 | $477,100 | $286,000 | $191,100 |
| 2019 | $5,991 | $451,100 | $260,000 | $191,100 |
| 2018 | $5,755 | $425,000 | $257,400 | $167,600 |
| 2017 | $5,534 | $390,000 | $224,900 | $165,100 |
| 2016 | $5,275 | $371,500 | $214,500 | $157,000 |
| 2015 | $5,013 | $336,200 | $195,000 | $141,200 |
Source: Public Records
Map
Nearby Homes
- 360 Andover St Unit 1310
- 2 Pat Dr
- 98 Newbury St Unit 4B
- 98 Newbury St Unit 18B
- 103 Newbury St Unit 3
- 103 Newbury St Unit 1
- 96 Newbury St Unit 6B
- 4 Briarwood Dr
- 37 Peaslee Cir Unit 37
- 286 Newbury St Unit 110
- 286 Newbury St Unit 52
- 8 Brookside Rd
- 15 Peachey Cir Unit 204
- 6 Greystone Dr
- 261 Newbury St Unit 33B
- 261 Newbury St Unit 72C
- 252 Newbury St Unit 71
- 252 Newbury St Unit 1
- 320 Newbury St Unit 304
- 251 Newbury St Unit 23