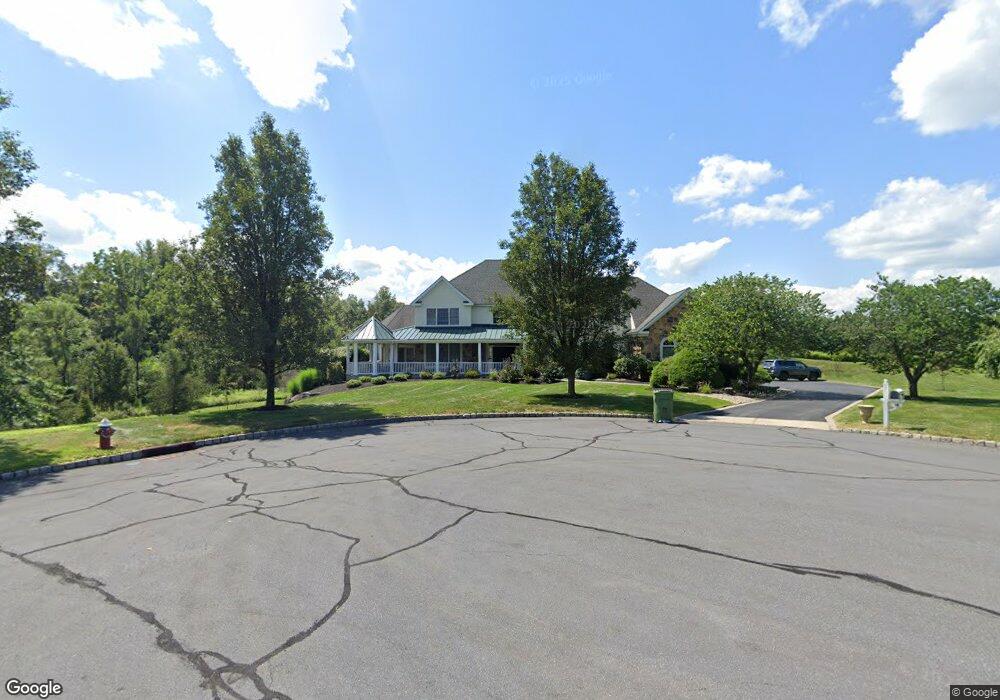
14 Grouse Ct Skillman, NJ 08558
Estimated Value: $1,200,000 - $2,011,000
4
Beds
5
Baths
5,200
Sq Ft
$326/Sq Ft
Est. Value
About This Home
This home is located at 14 Grouse Ct, Skillman, NJ 08558 and is currently estimated at $1,697,337, approximately $326 per square foot. 14 Grouse Ct is a home located in Somerset County with nearby schools including Orchard Hill Elementary School, Montgomery Lower Mid School, and Village Elementary School.
Ownership History
Date
Name
Owned For
Owner Type
Purchase Details
Closed on
Nov 23, 2021
Sold by
Thakkar Rosy and Thakkar Gurveen
Bought by
Singh Supinder and Thakkar Rosy
Current Estimated Value
Purchase Details
Closed on
Nov 12, 2019
Sold by
Singh Supinder and Thakkar Rosy
Bought by
The Sgg Trust and Rgg Trust
Purchase Details
Closed on
Feb 19, 2008
Sold by
Bishop Philippe and Eiseman Elisa
Bought by
Singh Supinder and Thakkar Rosy
Home Financials for this Owner
Home Financials are based on the most recent Mortgage that was taken out on this home.
Original Mortgage
$750,000
Interest Rate
6.43%
Mortgage Type
Purchase Money Mortgage
Purchase Details
Closed on
Sep 12, 2003
Sold by
Mbs Development Llc
Bought by
Bishop Philippe and Eiseman Elisa
Create a Home Valuation Report for This Property
The Home Valuation Report is an in-depth analysis detailing your home's value as well as a comparison with similar homes in the area
Home Values in the Area
Average Home Value in this Area
Purchase History
| Date | Buyer | Sale Price | Title Company |
|---|---|---|---|
| Singh Supinder | -- | None Available | |
| Srgg Living Trust | -- | Shah Nee | |
| The Sgg Trust | -- | None Available | |
| Singh Supinder | $1,325,000 | Multiple | |
| Bishop Philippe | $950,000 | -- |
Source: Public Records
Mortgage History
| Date | Status | Borrower | Loan Amount |
|---|---|---|---|
| Previous Owner | Singh Supinder | $750,000 |
Source: Public Records
Tax History Compared to Growth
Tax History
| Year | Tax Paid | Tax Assessment Tax Assessment Total Assessment is a certain percentage of the fair market value that is determined by local assessors to be the total taxable value of land and additions on the property. | Land | Improvement |
|---|---|---|---|---|
| 2025 | $30,513 | $890,100 | $287,200 | $602,900 |
| 2024 | $30,513 | $890,100 | $287,200 | $602,900 |
| 2023 | $30,468 | $890,100 | $287,200 | $602,900 |
| 2022 | $28,688 | $890,100 | $287,200 | $602,900 |
| 2021 | $28,439 | $890,100 | $287,200 | $602,900 |
| 2020 | $28,198 | $890,100 | $287,200 | $602,900 |
| 2019 | $28,003 | $890,100 | $287,200 | $602,900 |
| 2018 | $27,344 | $890,100 | $287,200 | $602,900 |
| 2017 | $26,926 | $890,100 | $287,200 | $602,900 |
| 2016 | $26,454 | $890,100 | $287,200 | $602,900 |
| 2015 | $25,866 | $890,100 | $287,200 | $602,900 |
| 2014 | $25,555 | $890,100 | $287,200 | $602,900 |
Source: Public Records
Map
Nearby Homes
- 74 Dublin Rd
- 16 Dorland Farm Ct
- 44 Bridle Path
- 00 Route 518
- 1723 Us Highway 206
- 11 Cortland Place
- 28 Bedford Dr
- 325 Mountain View Rd
- 0 Mountain View Rd
- 00 W Dutchtown Harlingen Rd
- 48 Fairview Rd
- 21 Harlingen Rd
- 2 E Hartwick Dr
- 252 Grandview Rd
- 17 E Hartwick Dr
- 45 Camp Meeting Ave
- 74 Harlingen Rd
- 106 Village Dr
- 43 Dead Tree Run Rd
- 263 Dutchtown Zion Rd