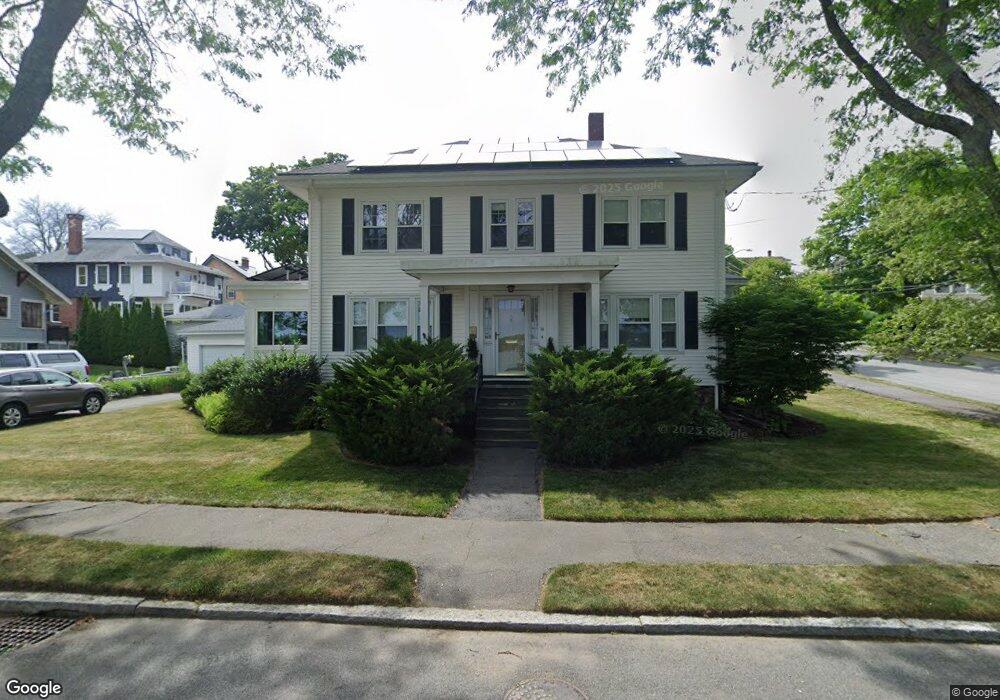
14 Hemenway Rd Salem, MA 01970
South Salem NeighborhoodEstimated Value: $843,000 - $1,072,000
4
Beds
2
Baths
1,982
Sq Ft
$469/Sq Ft
Est. Value
About This Home
This home is located at 14 Hemenway Rd, Salem, MA 01970 and is currently estimated at $929,716, approximately $469 per square foot. 14 Hemenway Rd is a home located in Essex County with nearby schools including Saltonstall School, Horace Mann Laboratory, and Carlton Elementary School.
Ownership History
Date
Name
Owned For
Owner Type
Purchase Details
Closed on
Jan 16, 2025
Sold by
Mansfield Dolores L
Bought by
Dolores Lynn Mansfield Lt and Mansfield
Current Estimated Value
Purchase Details
Closed on
Jan 1, 1972
Bought by
Mansfield Edward S and Mansfield Dolores L
Create a Home Valuation Report for This Property
The Home Valuation Report is an in-depth analysis detailing your home's value as well as a comparison with similar homes in the area
Home Values in the Area
Average Home Value in this Area
Purchase History
| Date | Buyer | Sale Price | Title Company |
|---|---|---|---|
| Dolores Lynn Mansfield Lt | -- | None Available | |
| Mansfield Edward S | $40,000 | -- |
Source: Public Records
Mortgage History
| Date | Status | Borrower | Loan Amount |
|---|---|---|---|
| Previous Owner | Mansfield Edward S | $50,000 | |
| Previous Owner | Mansfield Edward S | $50,000 | |
| Previous Owner | Mansfield Edward S | $66,000 | |
| Previous Owner | Mansfield Edward S | $60,000 |
Source: Public Records
Tax History Compared to Growth
Tax History
| Year | Tax Paid | Tax Assessment Tax Assessment Total Assessment is a certain percentage of the fair market value that is determined by local assessors to be the total taxable value of land and additions on the property. | Land | Improvement |
|---|---|---|---|---|
| 2025 | $10,129 | $893,200 | $404,700 | $488,500 |
| 2024 | $9,776 | $841,300 | $375,800 | $465,500 |
| 2023 | $9,383 | $750,000 | $346,900 | $403,100 |
| 2022 | $8,941 | $674,800 | $327,600 | $347,200 |
| 2021 | $9,231 | $668,900 | $327,600 | $341,300 |
| 2020 | $8,784 | $607,900 | $273,000 | $334,900 |
| 2019 | $8,714 | $577,100 | $265,000 | $312,100 |
| 2018 | $8,467 | $550,500 | $252,900 | $297,600 |
| 2017 | $8,184 | $516,000 | $228,800 | $287,200 |
| 2016 | $8,086 | $516,000 | $228,800 | $287,200 |
| 2015 | $7,767 | $473,300 | $212,800 | $260,500 |
Source: Public Records
Map
Nearby Homes
- 327 Lafayette St Unit 2
- 17 Cliff St
- 24 Wisteria St Unit 2
- 436 Lafayette St
- 4 Willow Ave Unit 2
- 9 Glover St Unit 1
- 14 Meadow St
- 11 Sumner Rd
- 10 Hazel St Unit 2
- 2A Hazel St Unit 3
- 263 Jefferson Ave
- 10 Quadrant Rd
- 16 Leavitt St Unit 2
- 7 Fairfield St
- 23 Marion Rd Unit B
- 155 Village St
- 9 Lyme St
- 10 Horton St
- 83 Lafayette St
- 24-26 Knight Ave