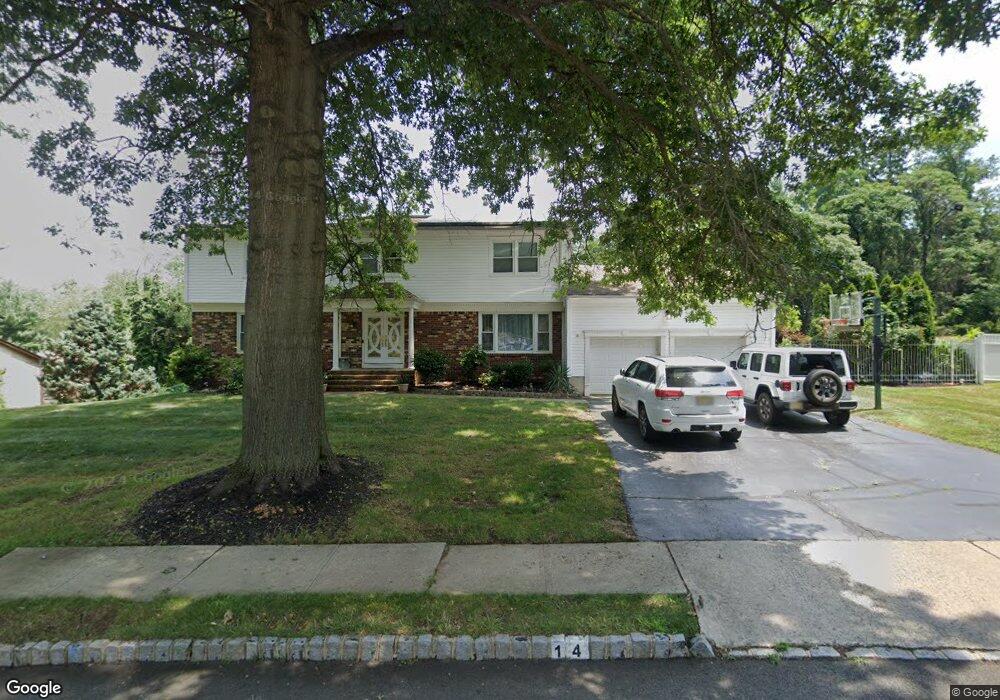
14 Hemlock Ln Marlboro, NJ 07746
Estimated Value: $939,000 - $1,051,000
4
Beds
2
Baths
3,000
Sq Ft
$333/Sq Ft
Est. Value
About This Home
This home is located at 14 Hemlock Ln, Marlboro, NJ 07746 and is currently estimated at $1,000,477, approximately $333 per square foot. 14 Hemlock Ln is a home located in Monmouth County with nearby schools including Asher Holmes Elementary School, Marlboro Middle School, and Marlboro High School.
Ownership History
Date
Name
Owned For
Owner Type
Purchase Details
Closed on
Sep 11, 2014
Sold by
Marshall Noah and Marshall Clara G
Bought by
Marshall Noah and Marshall Clara G
Current Estimated Value
Purchase Details
Closed on
Apr 5, 2001
Sold by
Aames Capital Corp
Bought by
Cifone Salvatore and Cifone Eileen
Home Financials for this Owner
Home Financials are based on the most recent Mortgage that was taken out on this home.
Original Mortgage
$190,000
Outstanding Balance
$67,706
Interest Rate
6.9%
Estimated Equity
$932,771
Create a Home Valuation Report for This Property
The Home Valuation Report is an in-depth analysis detailing your home's value as well as a comparison with similar homes in the area
Home Values in the Area
Average Home Value in this Area
Purchase History
| Date | Buyer | Sale Price | Title Company |
|---|---|---|---|
| Marshall Noah | -- | None Available | |
| Cifone Salvatore | $339,900 | -- |
Source: Public Records
Mortgage History
| Date | Status | Borrower | Loan Amount |
|---|---|---|---|
| Open | Cifone Salvatore | $190,000 |
Source: Public Records
Tax History Compared to Growth
Tax History
| Year | Tax Paid | Tax Assessment Tax Assessment Total Assessment is a certain percentage of the fair market value that is determined by local assessors to be the total taxable value of land and additions on the property. | Land | Improvement |
|---|---|---|---|---|
| 2025 | $13,338 | $534,800 | $185,000 | $349,800 |
| 2024 | $12,750 | $534,800 | $185,000 | $349,800 |
| 2023 | $12,750 | $534,800 | $185,000 | $349,800 |
| 2022 | $12,423 | $534,800 | $185,000 | $349,800 |
| 2021 | $12,300 | $534,800 | $185,000 | $349,800 |
| 2020 | $12,295 | $534,800 | $185,000 | $349,800 |
| 2019 | $12,300 | $534,800 | $185,000 | $349,800 |
| 2018 | $12,092 | $534,800 | $185,000 | $349,800 |
| 2017 | $11,857 | $534,800 | $185,000 | $349,800 |
| 2016 | $11,808 | $534,800 | $185,000 | $349,800 |
| 2015 | $11,140 | $512,200 | $185,000 | $327,200 |
| 2014 | $10,317 | $469,400 | $155,000 | $314,400 |
Source: Public Records
Map
Nearby Homes
- 9 Bennett Ct
- 11 Woodview Dr
- 23 Eli Cir
- 34 Brookside Cir
- 126 Wyncrest Rd
- 308 Pilot St
- 37 Willow Grove Way
- 4 Terrace Dr
- 21 Wickatunk Rd
- 25 Highland Dr
- 54 Tracy Dr
- 7 Syngle Way
- 218 Medford Ct Unit A
- 5 Homestead Cir
- 236 Medford Ct Unit G
- 69 Caldwell Terrace
- 102 Parker Chase
- 11 Churchill Ct
- 205 Covered Bridge Blvd Unit K
- 41 Longstreet Rd