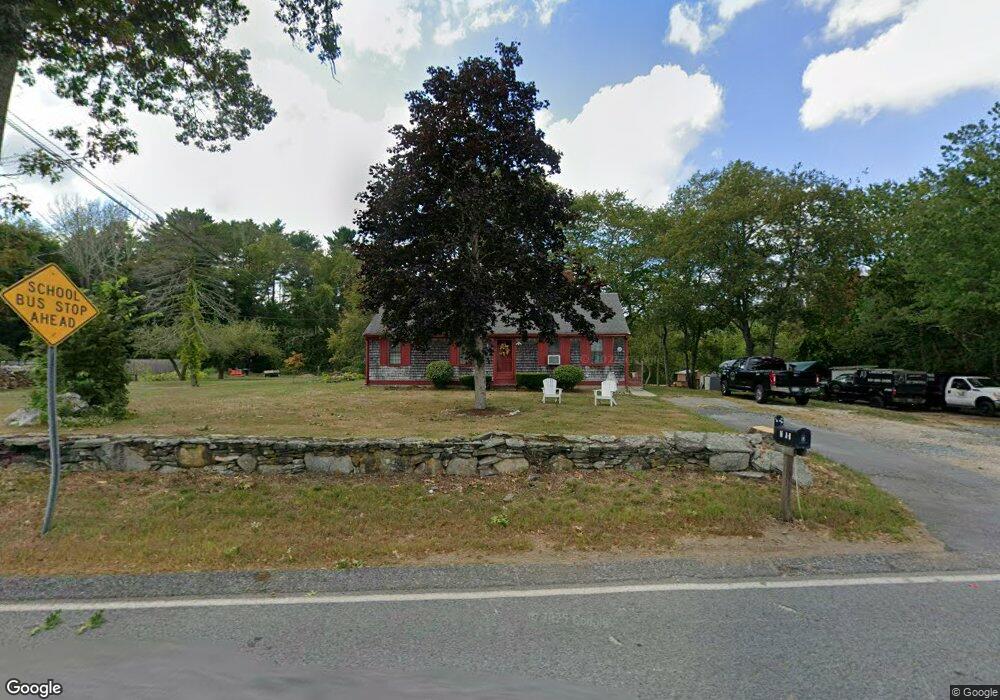
14 High St Carver, MA 02330
Estimated Value: $500,000 - $546,835
3
Beds
1
Bath
1,242
Sq Ft
$423/Sq Ft
Est. Value
About This Home
This home is located at 14 High St, Carver, MA 02330 and is currently estimated at $525,209, approximately $422 per square foot. 14 High St is a home located in Plymouth County with nearby schools including Carver Elementary School.
Ownership History
Date
Name
Owned For
Owner Type
Purchase Details
Closed on
Oct 4, 2004
Sold by
Hibbard Joan
Bought by
Hunter Jeffrey A
Current Estimated Value
Home Financials for this Owner
Home Financials are based on the most recent Mortgage that was taken out on this home.
Original Mortgage
$214,400
Outstanding Balance
$106,466
Interest Rate
5.81%
Mortgage Type
Purchase Money Mortgage
Estimated Equity
$418,743
Create a Home Valuation Report for This Property
The Home Valuation Report is an in-depth analysis detailing your home's value as well as a comparison with similar homes in the area
Home Values in the Area
Average Home Value in this Area
Purchase History
| Date | Buyer | Sale Price | Title Company |
|---|---|---|---|
| Hunter Jeffrey A | $268,000 | -- |
Source: Public Records
Mortgage History
| Date | Status | Borrower | Loan Amount |
|---|---|---|---|
| Open | Hunter Jeffrey A | $214,400 | |
| Previous Owner | Hunter Jeffrey A | $50,000 | |
| Previous Owner | Hunter Jeffrey A | $51,000 | |
| Previous Owner | Hunter Jeffrey A | $50,000 |
Source: Public Records
Tax History Compared to Growth
Tax History
| Year | Tax Paid | Tax Assessment Tax Assessment Total Assessment is a certain percentage of the fair market value that is determined by local assessors to be the total taxable value of land and additions on the property. | Land | Improvement |
|---|---|---|---|---|
| 2025 | $5,974 | $430,700 | $162,100 | $268,600 |
| 2024 | $5,674 | $400,400 | $158,900 | $241,500 |
| 2023 | $5,344 | $366,300 | $158,900 | $207,400 |
| 2022 | $5,256 | $328,900 | $148,800 | $180,100 |
| 2021 | $5,128 | $302,700 | $138,800 | $163,900 |
| 2020 | $4,892 | $284,600 | $129,600 | $155,000 |
| 2019 | $4,723 | $277,000 | $125,800 | $151,200 |
| 2018 | $4,646 | $263,500 | $125,800 | $137,700 |
| 2017 | $4,281 | $242,000 | $116,100 | $125,900 |
| 2016 | $3,942 | $231,500 | $110,500 | $121,000 |
| 2015 | $3,863 | $227,100 | $110,500 | $116,600 |
| 2014 | $4,067 | $239,100 | $139,600 | $99,500 |
Source: Public Records
Map
Nearby Homes
- 135 Plymouth St
- 7 Green St
- 26 Santana Way Unit 26
- 11 Brockton Ave
- 6 Susan Cir
- 23 Shaw St
- 122 High St
- 35 Silva St
- 20 Spring St
- Lot1 Elk Run Dr
- 6 Kestrel Way
- 64 Wenham Rd
- 0 Spring St
- 81 Center St
- 162 Plympton St
- 50 Elm St
- 0 Palmer Rd Unit 73436672
- 14 Cushman Landing
- 141 Rocky Meadow St
- 25 Dukes Brook Rd