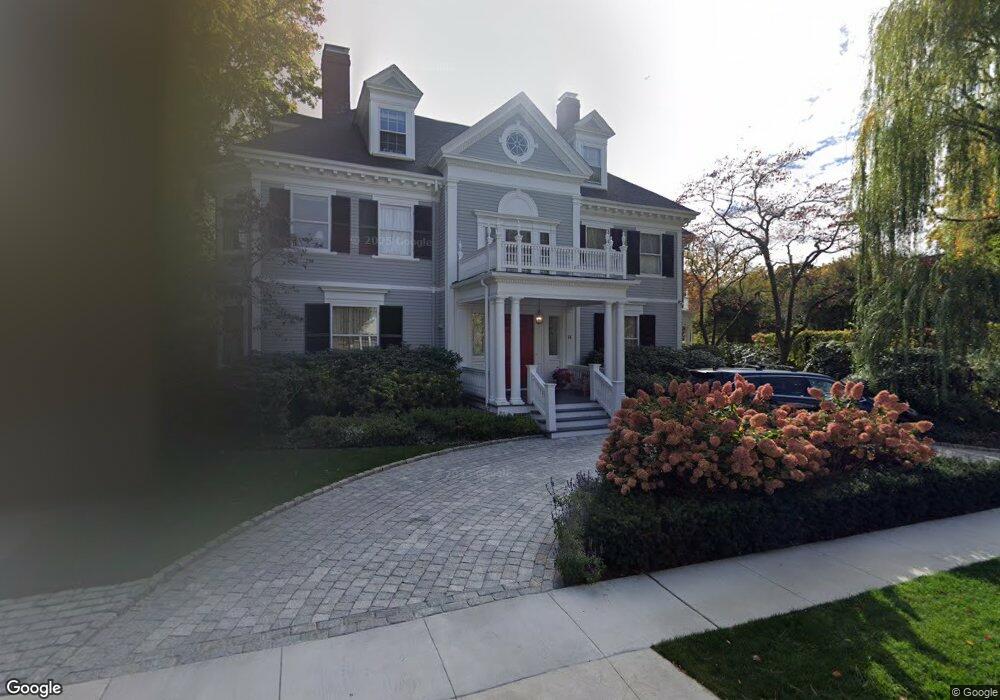
14 Hubbard Park Rd Cambridge, MA 02138
West Cambridge NeighborhoodEstimated Value: $5,780,000 - $13,939,711
6
Beds
7
Baths
7,474
Sq Ft
$1,319/Sq Ft
Est. Value
About This Home
This home is located at 14 Hubbard Park Rd, Cambridge, MA 02138 and is currently estimated at $9,859,856, approximately $1,319 per square foot. 14 Hubbard Park Rd is a home located in Middlesex County with nearby schools including St Peter School, Cambridge Montessori School, and Buckingham Browne & Nichols School.
Ownership History
Date
Name
Owned For
Owner Type
Purchase Details
Closed on
Dec 19, 2024
Sold by
Sagan Alex P
Bought by
Altman Julie
Current Estimated Value
Purchase Details
Closed on
Aug 7, 1998
Sold by
Lowe Charles U
Bought by
Sagan Alex P
Home Financials for this Owner
Home Financials are based on the most recent Mortgage that was taken out on this home.
Original Mortgage
$1,000,000
Interest Rate
6.92%
Mortgage Type
Purchase Money Mortgage
Purchase Details
Closed on
Aug 28, 1992
Sold by
Zetzel Louis
Bought by
Lowe Charles U and Lowe Eileen J
Home Financials for this Owner
Home Financials are based on the most recent Mortgage that was taken out on this home.
Original Mortgage
$400,000
Interest Rate
8.09%
Mortgage Type
Purchase Money Mortgage
Create a Home Valuation Report for This Property
The Home Valuation Report is an in-depth analysis detailing your home's value as well as a comparison with similar homes in the area
Home Values in the Area
Average Home Value in this Area
Purchase History
| Date | Buyer | Sale Price | Title Company |
|---|---|---|---|
| Altman Julie | -- | None Available | |
| Altman Julie | -- | None Available | |
| Altman Julie | -- | None Available | |
| Sagan Alex P | $3,400,000 | -- | |
| Lowe Charles U | $1,800,000 | -- | |
| Sagan Alex P | $3,400,000 | -- | |
| Lowe Charles U | $1,800,000 | -- |
Source: Public Records
Mortgage History
| Date | Status | Borrower | Loan Amount |
|---|---|---|---|
| Previous Owner | Lowe Charles U | $1,000,000 | |
| Previous Owner | Lowe Charles U | $400,000 | |
| Previous Owner | Lowe Charles U | $400,000 |
Source: Public Records
Tax History Compared to Growth
Tax History
| Year | Tax Paid | Tax Assessment Tax Assessment Total Assessment is a certain percentage of the fair market value that is determined by local assessors to be the total taxable value of land and additions on the property. | Land | Improvement |
|---|---|---|---|---|
| 2025 | $76,210 | $12,001,500 | $5,397,600 | $6,603,900 |
| 2024 | $68,262 | $11,530,700 | $5,354,300 | $6,176,400 |
| 2023 | $61,882 | $10,560,000 | $5,248,900 | $5,311,100 |
| 2022 | $57,211 | $9,664,100 | $4,957,700 | $4,706,400 |
| 2021 | $53,795 | $9,195,700 | $4,816,900 | $4,378,800 |
| 2020 | $50,406 | $8,766,200 | $4,620,800 | $4,145,400 |
| 2019 | $45,876 | $7,723,300 | $3,892,300 | $3,831,000 |
| 2018 | $47,343 | $7,526,700 | $3,871,900 | $3,654,800 |
| 2017 | $46,177 | $7,115,100 | $3,692,600 | $3,422,500 |
| 2016 | $44,182 | $6,320,800 | $3,193,700 | $3,127,100 |
| 2015 | $45,229 | $5,783,700 | $2,994,000 | $2,789,700 |
| 2014 | $47,483 | $5,666,200 | $2,914,000 | $2,752,200 |
Source: Public Records
Map
Nearby Homes
- 15 Hubbard Park Rd
- 48 Hubbard Park Rd
- 153 Brattle St
- 20 Maynard Place
- 158 Brattle St
- 1010 Memorial Dr Unit 6G
- 172 Brattle St
- 3 Berkeley Place
- 234 Huron Ave
- 32 Hawthorn St
- 12 Berkeley St
- 22 Concord Ave Unit 10
- 52 Garden St Unit B2
- 44 Garden St
- 988 Memorial Dr Unit 386
- 148 Huron Ave
- 71-73 Reservoir St
- 5 Brewer St Unit 5
- 202 Garden St
- 92 Fayerweather St Unit 2
- 12 Hubbard Park Rd
- 20 Hubbard Park Rd
- 114 Foster St
- 120 Foster St
- 43 Gibson St
- 19 Hubbard Park Rd
- 11 Hubbard Park Rd Unit 15
- 106 Foster St
- 9 Kenway St
- 9 Kenway St Unit House
- 9 Kenway St Unit 9
- 9 Doane St
- 5 Kenway St
- 8 Hubbard Park Rd
- 41 Gibson St
- 100 Foster St
- 98 Foster St
- 7 Hubbard Park Rd
- 26 Hubbard Park Rd
- 98 Foster St