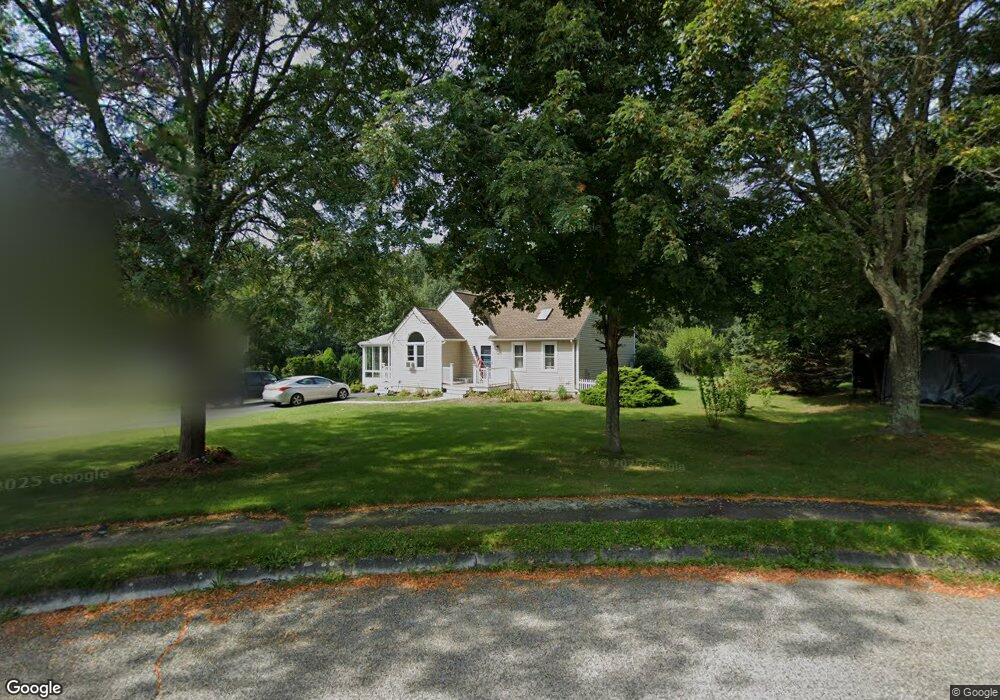
14 Ingrid Dr Mansfield, MA 02048
Estimated Value: $450,000 - $624,000
3
Beds
2
Baths
1,008
Sq Ft
$538/Sq Ft
Est. Value
About This Home
This home is located at 14 Ingrid Dr, Mansfield, MA 02048 and is currently estimated at $542,698, approximately $538 per square foot. 14 Ingrid Dr is a home located in Bristol County with nearby schools including Everett W. Robinson Elementary School, Jordan/Jackson Elementary School, and Harold L. Qualters Middle School.
Ownership History
Date
Name
Owned For
Owner Type
Purchase Details
Closed on
Mar 1, 1994
Sold by
Harrington & Matto Co
Bought by
Heffernan Robert J and Heffernan Lisa A
Current Estimated Value
Home Financials for this Owner
Home Financials are based on the most recent Mortgage that was taken out on this home.
Original Mortgage
$128,300
Interest Rate
6.96%
Mortgage Type
Purchase Money Mortgage
Purchase Details
Closed on
May 20, 1993
Sold by
Meszoely Charles Am and Meszoely Janice
Bought by
Harrington & Matto Co
Home Financials for this Owner
Home Financials are based on the most recent Mortgage that was taken out on this home.
Original Mortgage
$94,850
Interest Rate
7.54%
Mortgage Type
Purchase Money Mortgage
Create a Home Valuation Report for This Property
The Home Valuation Report is an in-depth analysis detailing your home's value as well as a comparison with similar homes in the area
Home Values in the Area
Average Home Value in this Area
Purchase History
| Date | Buyer | Sale Price | Title Company |
|---|---|---|---|
| Heffernan Robert J | $135,100 | -- | |
| Harrington & Matto Co | $55,000 | -- |
Source: Public Records
Mortgage History
| Date | Status | Borrower | Loan Amount |
|---|---|---|---|
| Closed | Harrington & Matto Co | $133,000 | |
| Closed | Harrington & Matto Co | $126,500 | |
| Closed | Harrington & Matto Co | $128,300 | |
| Previous Owner | Harrington & Matto Co | $94,850 | |
| Closed | Harrington & Matto Co | $18,000 |
Source: Public Records
Tax History Compared to Growth
Tax History
| Year | Tax Paid | Tax Assessment Tax Assessment Total Assessment is a certain percentage of the fair market value that is determined by local assessors to be the total taxable value of land and additions on the property. | Land | Improvement |
|---|---|---|---|---|
| 2025 | $6,121 | $464,800 | $242,000 | $222,800 |
| 2024 | $6,145 | $455,200 | $231,000 | $224,200 |
| 2023 | $6,021 | $427,300 | $231,000 | $196,300 |
| 2022 | $5,824 | $383,900 | $213,800 | $170,100 |
| 2021 | $5,889 | $383,400 | $203,700 | $179,700 |
| 2020 | $5,315 | $346,000 | $178,200 | $167,800 |
| 2019 | $5,277 | $346,700 | $169,600 | $177,100 |
| 2018 | $5,066 | $325,400 | $161,800 | $163,600 |
| 2017 | $4,740 | $315,600 | $157,200 | $158,400 |
| 2016 | $4,725 | $306,600 | $149,700 | $156,900 |
| 2015 | $4,413 | $284,700 | $149,700 | $135,000 |
Source: Public Records
Map
Nearby Homes
- 24 Maverick Dr
- 4 Buckskin Dr
- 406 South St
- 150 Gilbert St
- 16 Treasure Island Rd
- 116 George St
- 11 Landry Ave
- 196 Donald Tennant Cir
- 9 Oak Dr
- 5 Old Wood Rd
- 255 Mckeon Dr
- 15 Old Wood Rd
- 28 Messenger St
- 450 West St
- 57 Vine St
- 115 Westfield Dr
- 9 Sunnyside Dr Unit 9
- 126 Washington St
- 130 Washington St
- 124 Washington St