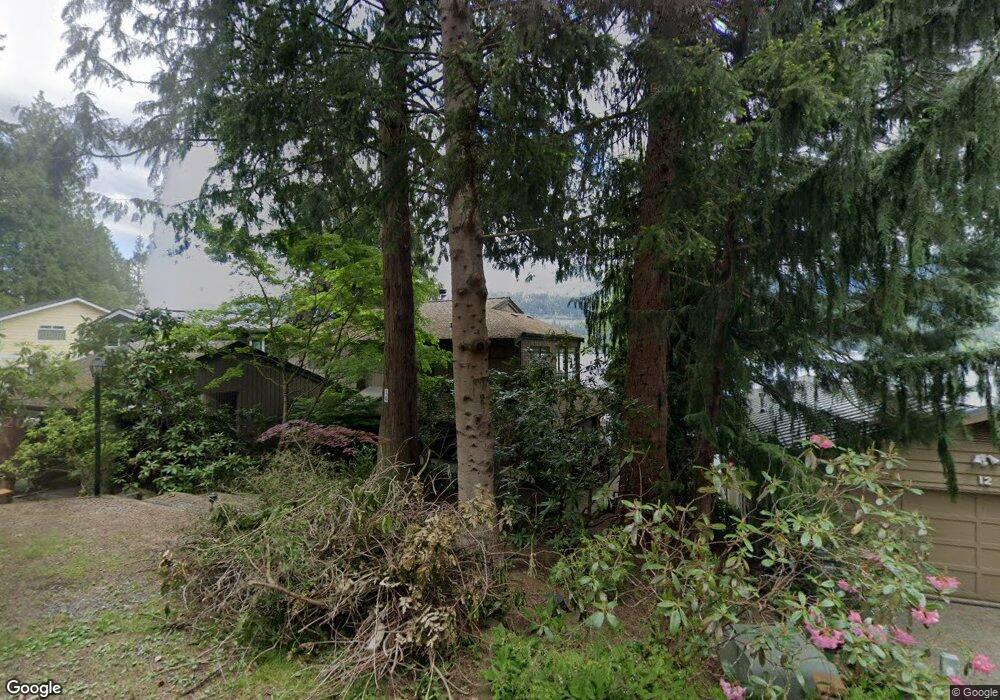
14 Inlet Cir Unit B Bellingham, WA 98229
Estimated Value: $878,000 - $1,285,000
3
Beds
2
Baths
1,773
Sq Ft
$650/Sq Ft
Est. Value
About This Home
This home is located at 14 Inlet Cir Unit B, Bellingham, WA 98229 and is currently estimated at $1,151,806, approximately $649 per square foot. 14 Inlet Cir Unit B is a home located in Whatcom County with nearby schools including Geneva Elementary School, Kulshan Middle School, and Bellingham High School.
Ownership History
Date
Name
Owned For
Owner Type
Purchase Details
Closed on
Jun 27, 2018
Sold by
Harruff David F and Harruff Megghan M
Bought by
Plant Jeffrey J and Plant Jolaine B
Current Estimated Value
Home Financials for this Owner
Home Financials are based on the most recent Mortgage that was taken out on this home.
Original Mortgage
$714,000
Outstanding Balance
$620,156
Interest Rate
4.6%
Mortgage Type
New Conventional
Estimated Equity
$531,650
Purchase Details
Closed on
Nov 1, 1999
Sold by
Giacomi Gary L and Giacomi Susan M
Bought by
Harruff David F and Harruff Megghan M
Home Financials for this Owner
Home Financials are based on the most recent Mortgage that was taken out on this home.
Original Mortgage
$291,000
Interest Rate
7.75%
Create a Home Valuation Report for This Property
The Home Valuation Report is an in-depth analysis detailing your home's value as well as a comparison with similar homes in the area
Home Values in the Area
Average Home Value in this Area
Purchase History
| Date | Buyer | Sale Price | Title Company |
|---|---|---|---|
| Plant Jeffrey J | $892,500 | Chicago Title | |
| Harruff David F | $317,174 | Chicago Title Insurance Co |
Source: Public Records
Mortgage History
| Date | Status | Borrower | Loan Amount |
|---|---|---|---|
| Open | Plant Jeffrey J | $714,000 | |
| Previous Owner | Harruff David F | $291,000 |
Source: Public Records
Tax History Compared to Growth
Tax History
| Year | Tax Paid | Tax Assessment Tax Assessment Total Assessment is a certain percentage of the fair market value that is determined by local assessors to be the total taxable value of land and additions on the property. | Land | Improvement |
|---|---|---|---|---|
| 2024 | $10,568 | $1,213,652 | $482,679 | $730,973 |
| 2023 | $10,568 | $1,244,541 | $494,964 | $749,577 |
| 2022 | $7,856 | $1,011,818 | $402,408 | $609,410 |
| 2021 | $7,398 | $733,201 | $291,600 | $441,601 |
| 2020 | $6,462 | $678,890 | $270,000 | $408,890 |
| 2019 | $5,749 | $580,002 | $267,880 | $312,122 |
| 2018 | $5,826 | $523,925 | $241,980 | $281,945 |
| 2017 | $5,241 | $452,225 | $208,865 | $243,360 |
| 2016 | $4,767 | $424,187 | $195,915 | $228,272 |
| 2015 | $4,870 | $404,159 | $186,665 | $217,494 |
| 2014 | -- | $400,554 | $185,000 | $215,554 |
| 2013 | -- | $390,028 | $182,500 | $207,528 |
Source: Public Records
Map
Nearby Homes
- 20 N Point Dr
- 69 N Point Dr
- 46 N Point Dr
- 7 Deer Run Ln
- 20 Hillside Place
- 34 Green Hill Rd
- 1 Valley Crest Way
- 76B Sudden Valley Dr
- 1 Morning Beach Dr Unit 38
- 434 Sudden Valley Dr
- 19 Valley Crest Way
- 22 Jasper Ridge Ln
- 24 Jasper Ridge Ln
- 137 Sudden Valley Dr
- 43 Rocky Ridge Dr
- 422 Sudden Valley Dr
- 36 Holly View Way
- 22 Marigold Dr Unit 34
- 22 Marigold Dr Unit 45
- 14 Black Bear Ct Unit A