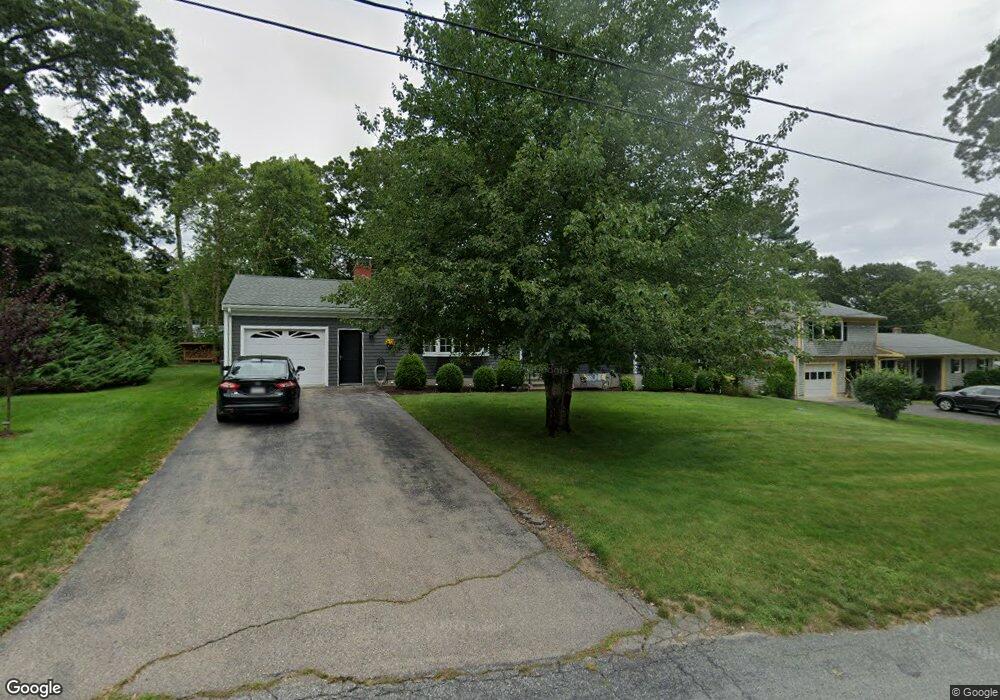
14 James Ave Westport, MA 02790
North Westport NeighborhoodEstimated Value: $452,187 - $517,000
2
Beds
4
Baths
1,376
Sq Ft
$344/Sq Ft
Est. Value
About This Home
This home is located at 14 James Ave, Westport, MA 02790 and is currently estimated at $473,047, approximately $343 per square foot. 14 James Ave is a home located in Bristol County with nearby schools including Alice A. Macomber Primary School, Westport Elementary School, and Westport Middle-High School.
Ownership History
Date
Name
Owned For
Owner Type
Purchase Details
Closed on
Aug 7, 2001
Sold by
Lavoie Cynthia E and Fitton Pamela C
Bought by
Gendreau Dennis and Gendreau Lee A
Current Estimated Value
Home Financials for this Owner
Home Financials are based on the most recent Mortgage that was taken out on this home.
Original Mortgage
$133,000
Interest Rate
7.14%
Mortgage Type
Purchase Money Mortgage
Create a Home Valuation Report for This Property
The Home Valuation Report is an in-depth analysis detailing your home's value as well as a comparison with similar homes in the area
Home Values in the Area
Average Home Value in this Area
Purchase History
| Date | Buyer | Sale Price | Title Company |
|---|---|---|---|
| Gendreau Dennis | $168,000 | -- |
Source: Public Records
Mortgage History
| Date | Status | Borrower | Loan Amount |
|---|---|---|---|
| Open | Gendreau Dennis | $162,500 | |
| Closed | Gendreau Dennis | $156,500 | |
| Closed | Gendreau Dennis | $133,000 | |
| Previous Owner | Gendreau Dennis | $20,000 |
Source: Public Records
Tax History Compared to Growth
Tax History
| Year | Tax Paid | Tax Assessment Tax Assessment Total Assessment is a certain percentage of the fair market value that is determined by local assessors to be the total taxable value of land and additions on the property. | Land | Improvement |
|---|---|---|---|---|
| 2025 | $2,888 | $387,600 | $162,300 | $225,300 |
| 2024 | $2,880 | $372,600 | $150,400 | $222,200 |
| 2023 | $2,780 | $340,700 | $137,000 | $203,700 |
| 2022 | $2,524 | $297,700 | $124,600 | $173,100 |
| 2021 | $4,370 | $286,300 | $113,200 | $173,100 |
| 2020 | $2,376 | $281,800 | $108,700 | $173,100 |
| 2019 | $2,774 | $281,100 | $108,700 | $172,400 |
| 2018 | $2,163 | $264,700 | $109,900 | $154,800 |
| 2017 | $2,607 | $258,000 | $106,400 | $151,600 |
| 2016 | $1,901 | $240,300 | $102,800 | $137,500 |
| 2015 | $1,804 | $227,500 | $105,200 | $122,300 |
Source: Public Records
Map
Nearby Homes