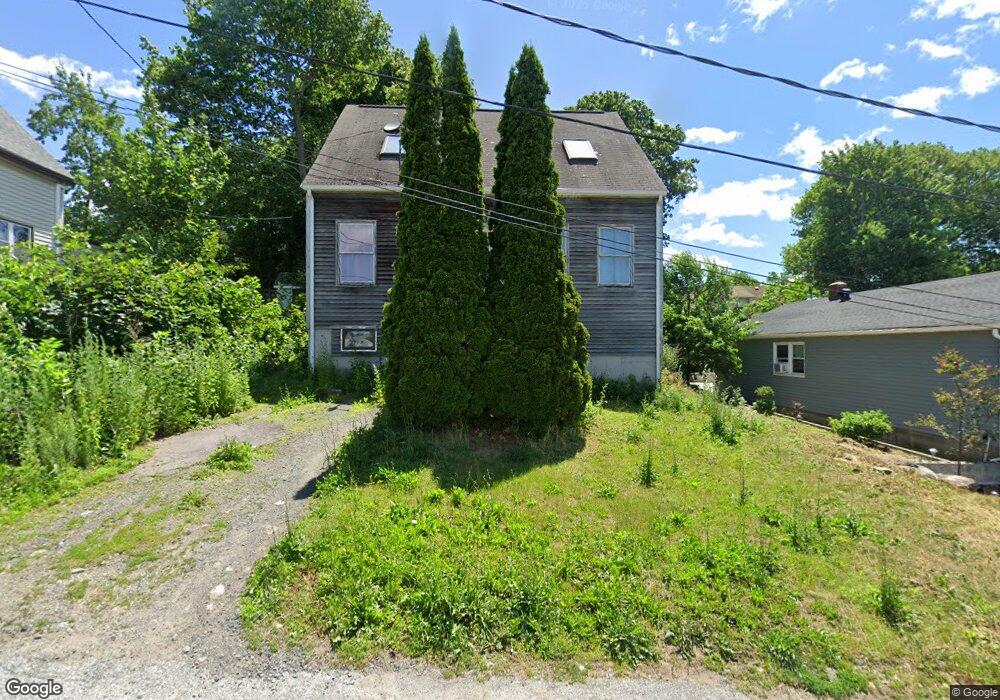
14 Jones Ct Lynn, MA 01902
Chatham Street NeighborhoodEstimated Value: $535,000 - $682,000
3
Beds
2
Baths
1,470
Sq Ft
$417/Sq Ft
Est. Value
About This Home
This home is located at 14 Jones Ct, Lynn, MA 01902 and is currently estimated at $612,825, approximately $416 per square foot. 14 Jones Ct is a home located in Essex County with nearby schools including Hood Elementary School, William R. Fallon School, and Marshall Middle School.
Ownership History
Date
Name
Owned For
Owner Type
Purchase Details
Closed on
Jul 11, 2023
Sold by
Donlon Jayne A
Bought by
Hotel California Irt and Staffier
Current Estimated Value
Purchase Details
Closed on
Sep 18, 1991
Sold by
Georgakis Constantinos
Bought by
Donlon Jayne A and Donlon Gerald L
Create a Home Valuation Report for This Property
The Home Valuation Report is an in-depth analysis detailing your home's value as well as a comparison with similar homes in the area
Home Values in the Area
Average Home Value in this Area
Purchase History
| Date | Buyer | Sale Price | Title Company |
|---|---|---|---|
| Hotel California Irt | -- | None Available | |
| Hotel California Irt | -- | None Available | |
| Hotel California Irt | -- | None Available | |
| Hotel California Irt | -- | None Available | |
| Donlon Jayne A | $130,000 | -- | |
| Donlon Jayne A | $130,000 | -- |
Source: Public Records
Mortgage History
| Date | Status | Borrower | Loan Amount |
|---|---|---|---|
| Previous Owner | Donlon Jayne A | $110,000 | |
| Closed | Donlon Jayne A | $0 |
Source: Public Records
Tax History
| Year | Tax Paid | Tax Assessment Tax Assessment Total Assessment is a certain percentage of the fair market value that is determined by local assessors to be the total taxable value of land and additions on the property. | Land | Improvement |
|---|---|---|---|---|
| 2025 | $6,245 | $602,800 | $202,300 | $400,500 |
| 2024 | $6,091 | $578,400 | $192,600 | $385,800 |
| 2023 | $5,858 | $525,400 | $187,800 | $337,600 |
| 2022 | $5,928 | $476,900 | $156,700 | $320,200 |
| 2021 | $5,332 | $409,200 | $135,200 | $274,000 |
| 2020 | $5,162 | $385,200 | $127,700 | $257,500 |
| 2019 | $5,201 | $363,700 | $119,400 | $244,300 |
| 2018 | $4,915 | $324,400 | $116,300 | $208,100 |
| 2017 | $4,722 | $302,700 | $102,700 | $200,000 |
| 2016 | $4,503 | $278,300 | $90,800 | $187,500 |
| 2015 | $4,136 | $246,900 | $82,500 | $164,400 |
Source: Public Records
Map
Nearby Homes
- 531 A Chatham St
- 8 Waitt Ave
- 81 Glenwood St
- 582 Eastern Ave
- 129 Eutaw Ave
- 431-433 Chatham St
- 6A Goodridge St
- 48 Clarendon Ave
- 12 W Colony Rd
- 91 Oakwood Ave
- 31 Atkins Ave
- 16 Clinton St
- 55 Addison Ave
- 11 Birch St
- 50 Webster St
- 21 E Park Ave
- 10 Pond St
- 2 Chestnut Terrace
- 5 Rockingham St
- 38 Ledgemont Ln
Your Personal Tour Guide
Ask me questions while you tour the home.