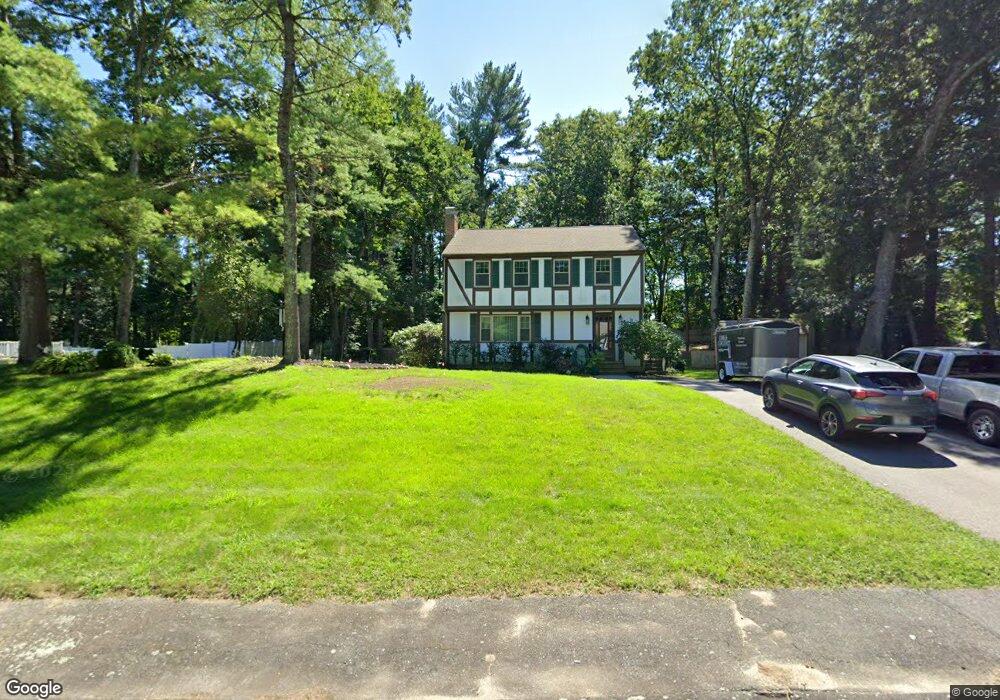
14 Joyce Ln Bellingham, MA 02019
Estimated Value: $514,000 - $575,000
4
Beds
2
Baths
1,500
Sq Ft
$362/Sq Ft
Est. Value
About This Home
This home is located at 14 Joyce Ln, Bellingham, MA 02019 and is currently estimated at $542,255, approximately $361 per square foot. 14 Joyce Ln is a home located in Norfolk County with nearby schools including Stall Brook Elementary School, Bellingham High School, and Bethany Christian Academy.
Ownership History
Date
Name
Owned For
Owner Type
Purchase Details
Closed on
Aug 18, 2019
Sold by
Puller Marsha E
Bought by
Marsha E Puller Ft and Puller
Current Estimated Value
Purchase Details
Closed on
Oct 24, 1983
Bought by
Puller Marsha E
Create a Home Valuation Report for This Property
The Home Valuation Report is an in-depth analysis detailing your home's value as well as a comparison with similar homes in the area
Home Values in the Area
Average Home Value in this Area
Purchase History
| Date | Buyer | Sale Price | Title Company |
|---|---|---|---|
| Marsha E Puller Ft | -- | -- | |
| Puller Marsha E | -- | -- |
Source: Public Records
Mortgage History
| Date | Status | Borrower | Loan Amount |
|---|---|---|---|
| Previous Owner | Puller Marsha E | $125,000 | |
| Previous Owner | Puller Marsha E | $92,500 | |
| Previous Owner | Puller Marsha E | $13,162 |
Source: Public Records
Tax History
| Year | Tax Paid | Tax Assessment Tax Assessment Total Assessment is a certain percentage of the fair market value that is determined by local assessors to be the total taxable value of land and additions on the property. | Land | Improvement |
|---|---|---|---|---|
| 2025 | $5,241 | $417,300 | $167,200 | $250,100 |
| 2024 | $5,014 | $389,900 | $152,600 | $237,300 |
| 2023 | $4,835 | $370,500 | $145,400 | $225,100 |
| 2022 | $4,708 | $334,400 | $121,200 | $213,200 |
| 2021 | $4,577 | $317,600 | $121,200 | $196,400 |
| 2020 | $4,314 | $303,400 | $121,200 | $182,200 |
| 2019 | $4,225 | $297,300 | $121,200 | $176,100 |
| 2018 | $3,921 | $272,100 | $116,600 | $155,500 |
| 2017 | $3,814 | $266,000 | $116,600 | $149,400 |
| 2016 | $3,635 | $254,400 | $114,600 | $139,800 |
| 2015 | $3,487 | $244,700 | $110,200 | $134,500 |
| 2014 | $3,496 | $238,500 | $107,700 | $130,800 |
Source: Public Records
Map
Nearby Homes
- 0 Hixon St Unit 73477486
- 67 Jeannine Rd
- 60 Wethersfield Rd
- 95 Lisa Ann Dr
- 48 Donna Rd
- 0 Hartford Ave
- 267 R S Main St
- 267 F S Main St
- 279 S Main St
- 48 Black Bear Cir Unit 48
- 256 S Main St
- 46 Black Bear Cir Unit 46
- 44 Black Bear Cir Unit 44
- 3 Black Bear Cir Unit 3
- 43 Black Bear Cir Unit 43
- 7 Black Bear Unit 7
- 9 Black Bear Cir Unit 9
- 11 Black Bear Unit 11
- 10 Black Bear Unit 10
- 13 Black Bear Cir Unit 13
- 10 Joyce Ln
- 18 Joyce Ln
- 15 Joyce Ln
- 19 Joyce Ln
- 8 Roger Belanger Dr
- 22 Joyce Ln
- 11 Joyce Ln
- 4 Roger Belanger Dr
- 106 Hartford Ave
- 23 Joyce Ln
- 7 Joyce Ln
- 102 Hartford Ave
- 107 Hartford Ave
- 7 Roger Belanger Dr
- 14 Roger Belanger Dr
- 26 Joyce Ln
- 3 Roger Belanger Dr
- 11 Roger Belanger Dr
- 27 Joyce Ln
- 111 Hartford Ave
Your Personal Tour Guide
Ask me questions while you tour the home.