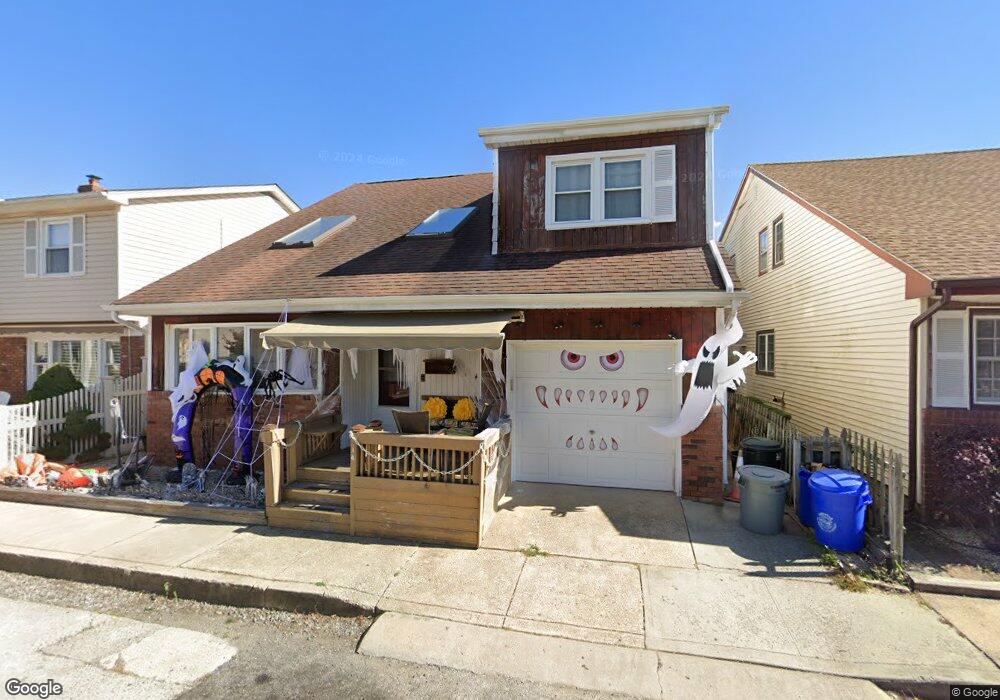
14 Kerrigan St Long Beach, NY 11561
Estimated Value: $820,546 - $850,000
3
Beds
3
Baths
1,730
Sq Ft
$483/Sq Ft
Est. Value
About This Home
This home is located at 14 Kerrigan St, Long Beach, NY 11561 and is currently estimated at $835,273, approximately $482 per square foot. 14 Kerrigan St is a home located in Nassau County with nearby schools including Lido Elementary School, East Elementary School, and Lindell Elementary School.
Ownership History
Date
Name
Owned For
Owner Type
Purchase Details
Closed on
Sep 12, 2016
Sold by
Barnett Michael and Barnett Ellen
Bought by
Lapi Dominick and Lapi Linda
Current Estimated Value
Home Financials for this Owner
Home Financials are based on the most recent Mortgage that was taken out on this home.
Original Mortgage
$462,453
Outstanding Balance
$374,523
Interest Rate
3.87%
Mortgage Type
FHA
Estimated Equity
$460,750
Purchase Details
Closed on
Jan 19, 1998
Sold by
Tarab Robert and Tarab Elaine
Bought by
Barnett Michael and Barnett Ellen
Create a Home Valuation Report for This Property
The Home Valuation Report is an in-depth analysis detailing your home's value as well as a comparison with similar homes in the area
Home Values in the Area
Average Home Value in this Area
Purchase History
| Date | Buyer | Sale Price | Title Company |
|---|---|---|---|
| Lapi Dominick | $505,000 | Chicago Title Insurance Comp | |
| Barnett Michael | $210,000 | -- |
Source: Public Records
Mortgage History
| Date | Status | Borrower | Loan Amount |
|---|---|---|---|
| Open | Lapi Dominick | $462,453 |
Source: Public Records
Tax History Compared to Growth
Tax History
| Year | Tax Paid | Tax Assessment Tax Assessment Total Assessment is a certain percentage of the fair market value that is determined by local assessors to be the total taxable value of land and additions on the property. | Land | Improvement |
|---|---|---|---|---|
| 2025 | $7,847 | $545 | $169 | $376 |
| 2024 | $995 | $532 | $165 | $367 |
| 2023 | $8,496 | $565 | $176 | $389 |
| 2022 | $8,496 | $547 | $170 | $377 |
| 2021 | $16,321 | $573 | $178 | $395 |
| 2020 | $13,394 | $1,092 | $656 | $436 |
| 2019 | $10,250 | $1,048 | $656 | $392 |
| 2018 | $10,016 | $1,048 | $0 | $0 |
| 2017 | $4,907 | $1,048 | $656 | $392 |
| 2016 | $970 | $1,048 | $656 | $392 |
| 2015 | $965 | $1,048 | $656 | $392 |
| 2014 | $965 | $1,048 | $656 | $392 |
| 2013 | $922 | $1,048 | $656 | $392 |
Source: Public Records
Map
Nearby Homes