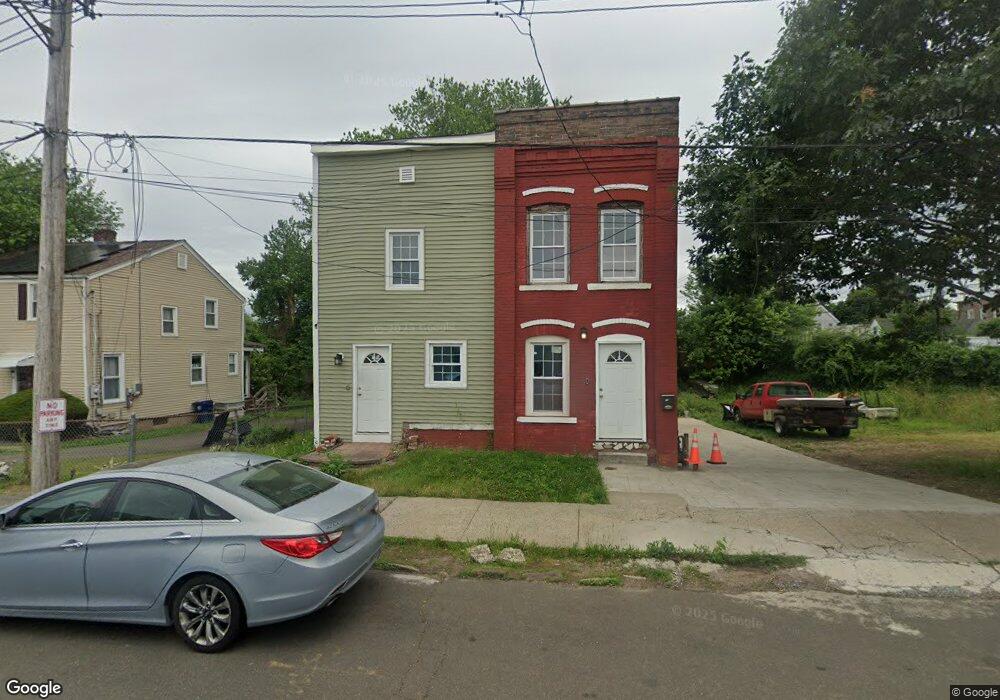
14 Lamson St West Haven, CT 06516
Allingtown NeighborhoodEstimated Value: $430,301 - $474,000
8
Beds
2
Baths
2,322
Sq Ft
$195/Sq Ft
Est. Value
About This Home
This home is located at 14 Lamson St, West Haven, CT 06516 and is currently estimated at $452,075, approximately $194 per square foot. 14 Lamson St is a home located in New Haven County with nearby schools including Carrigan 5/6 Intermediate School, Harry M. Bailey Middle School, and West Haven High School.
Ownership History
Date
Name
Owned For
Owner Type
Purchase Details
Closed on
Aug 12, 2025
Sold by
Cejas Mauricio
Bought by
14 Lamson Associates Llc
Current Estimated Value
Purchase Details
Closed on
Jul 18, 2011
Sold by
Department Of Housing & Urban Dev
Bought by
Cejas Mauricio
Home Financials for this Owner
Home Financials are based on the most recent Mortgage that was taken out on this home.
Original Mortgage
$93,750
Interest Rate
4.58%
Mortgage Type
Purchase Money Mortgage
Purchase Details
Closed on
Oct 22, 2010
Sold by
Bac Home Loan Svcng Lp
Bought by
Department Of Housing & Urban Dev
Purchase Details
Closed on
Jul 9, 2010
Sold by
Landino Lisa
Bought by
Bac Home Loans Svcng L
Purchase Details
Closed on
Dec 22, 2006
Sold by
Landino Dominick
Bought by
Landino Paul and Landino Lisa
Purchase Details
Closed on
Mar 25, 1998
Sold by
Destefano Ida
Bought by
Landino Dominick
Create a Home Valuation Report for This Property
The Home Valuation Report is an in-depth analysis detailing your home's value as well as a comparison with similar homes in the area
Home Values in the Area
Average Home Value in this Area
Purchase History
| Date | Buyer | Sale Price | Title Company |
|---|---|---|---|
| 14 Lamson Associates Llc | -- | -- | |
| Cejas Mauricio | $61,719 | -- | |
| Cejas Mauricio | $61,719 | -- | |
| Department Of Housing & Urban Dev | -- | -- | |
| Department Of Housing & Urban Dev | -- | -- | |
| Bac Home Loans Svcng L | -- | -- | |
| Bac Home Loans Svcng L | -- | -- | |
| Landino Paul | $155,000 | -- | |
| Landino Paul | $155,000 | -- | |
| Landino Dominick | $49,000 | -- | |
| Landino Dominick | $49,000 | -- |
Source: Public Records
Mortgage History
| Date | Status | Borrower | Loan Amount |
|---|---|---|---|
| Previous Owner | Landino Dominick | $93,750 |
Source: Public Records
Tax History Compared to Growth
Tax History
| Year | Tax Paid | Tax Assessment Tax Assessment Total Assessment is a certain percentage of the fair market value that is determined by local assessors to be the total taxable value of land and additions on the property. | Land | Improvement |
|---|---|---|---|---|
| 2025 | $9,581 | $277,480 | $55,580 | $221,900 |
| 2024 | $8,868 | $182,770 | $38,500 | $144,270 |
| 2023 | $8,501 | $182,770 | $38,500 | $144,270 |
| 2022 | $8,334 | $182,770 | $38,500 | $144,270 |
| 2021 | $7,650 | $182,770 | $38,500 | $144,270 |
| 2020 | $7,401 | $146,650 | $30,590 | $116,060 |
| 2019 | $5,322 | $109,340 | $30,590 | $78,750 |
| 2018 | $5,276 | $109,340 | $30,590 | $78,750 |
| 2017 | $4,992 | $109,340 | $30,590 | $78,750 |
| 2016 | $4,982 | $109,340 | $30,590 | $78,750 |
| 2015 | $4,482 | $111,090 | $35,350 | $75,740 |
| 2014 | $4,455 | $111,090 | $35,350 | $75,740 |
Source: Public Records
Map
Nearby Homes
- 43 Clifton St
- 22 Thill St
- 25 Richards St
- 941 Campbell Ave
- 1014 Campbell Ave Unit 14
- 14 Homestead Ave
- 170 Wood St
- 29 Abner St
- 28 Wharton St
- 104 Terrace Ave
- 194 Ella T Grasso Blvd
- 682 2nd Ave
- 484 1st Ave Unit 6
- 677 Washington Ave
- 24 George St
- 161 W Spring St Unit B2
- 161 W Spring St Unit C1
- 35 Terrace Ave
- 246 Elm St
- 81 Homeside Ave