14 Laurel Ave Westerly, RI 02891
Estimated Value: $531,163 - $644,000
4
Beds
2
Baths
1,788
Sq Ft
$333/Sq Ft
Est. Value
About This Home
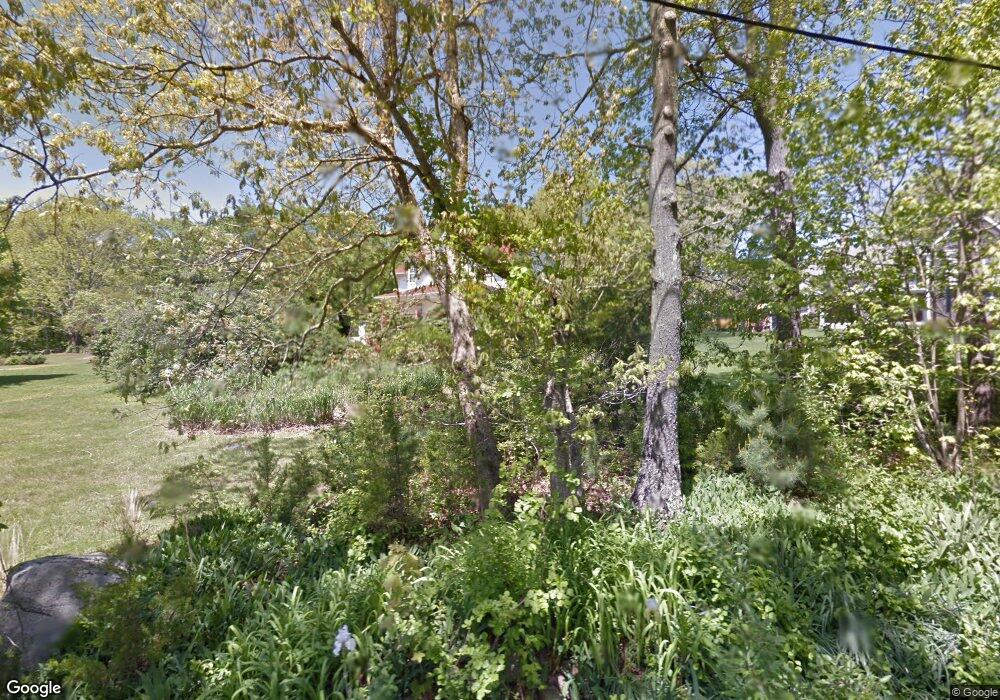
This home is located at 14 Laurel Ave, Westerly, RI 02891 and is currently estimated at $596,041, approximately $333 per square foot. 14 Laurel Ave is a home located in Washington County with nearby schools including Westerly High School, North Stonington Christian Academy, and St. Michael School.
Ownership History
Date
Name
Owned For
Owner Type
Purchase Details
Closed on
Jun 1, 2004
Sold by
Crowley Donald
Bought by
Makover Eran and Aberdam Elaine
Current Estimated Value
Home Financials for this Owner
Home Financials are based on the most recent Mortgage that was taken out on this home.
Original Mortgage
$260,000
Interest Rate
5.88%
Mortgage Type
Purchase Money Mortgage
Create a Home Valuation Report for This Property
The Home Valuation Report is an in-depth analysis detailing your home's value as well as a comparison with similar homes in the area
Home Values in the Area
Average Home Value in this Area
Purchase History
| Date | Buyer | Sale Price | Title Company |
|---|---|---|---|
| Makover Eran | $325,000 | -- |
Source: Public Records
Mortgage History
| Date | Status | Borrower | Loan Amount |
|---|---|---|---|
| Open | Makover Eran | $238,000 | |
| Closed | Makover Eran | $267,000 | |
| Closed | Makover Eran | $291,000 | |
| Closed | Makover Eran | $260,000 |
Source: Public Records
Tax History
| Year | Tax Paid | Tax Assessment Tax Assessment Total Assessment is a certain percentage of the fair market value that is determined by local assessors to be the total taxable value of land and additions on the property. | Land | Improvement |
|---|---|---|---|---|
| 2025 | $3,216 | $452,300 | $210,700 | $241,600 |
| 2024 | $3,385 | $345,100 | $150,600 | $194,500 |
| 2023 | $3,320 | $345,100 | $150,600 | $194,500 |
| 2022 | $3,299 | $345,100 | $150,600 | $194,500 |
| 2021 | $3,348 | $290,600 | $130,900 | $159,700 |
| 2020 | $3,287 | $290,600 | $130,900 | $159,700 |
| 2019 | $3,255 | $290,600 | $130,900 | $159,700 |
| 2018 | $3,154 | $265,500 | $130,900 | $134,600 |
| 2017 | $3,077 | $265,500 | $130,900 | $134,600 |
| 2016 | $3,101 | $265,500 | $130,900 | $134,600 |
| 2015 | $2,980 | $275,400 | $133,600 | $141,800 |
| 2014 | $2,930 | $275,400 | $133,600 | $141,800 |
Source: Public Records
Map
Nearby Homes
Your Personal Tour Guide
Ask me questions while you tour the home.