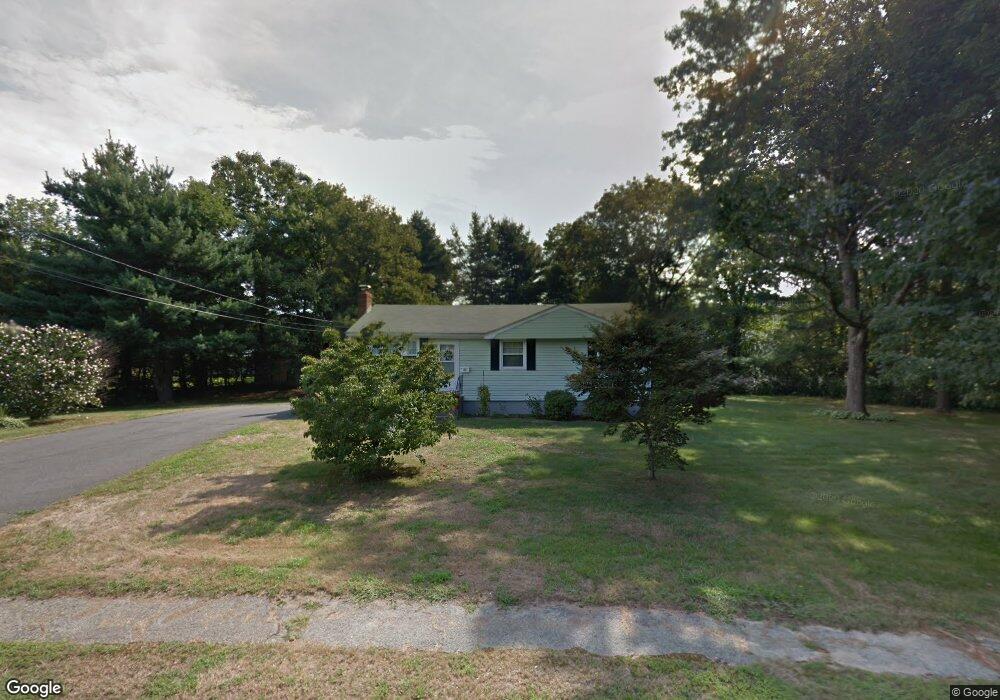
14 Linda St Foxboro, MA 02035
Estimated Value: $550,867 - $632,000
3
Beds
2
Baths
1,008
Sq Ft
$573/Sq Ft
Est. Value
About This Home
This home is located at 14 Linda St, Foxboro, MA 02035 and is currently estimated at $577,467, approximately $572 per square foot. 14 Linda St is a home located in Norfolk County with nearby schools including Foxborough High School, Foxborough Regional Charter School, and The Sage School.
Ownership History
Date
Name
Owned For
Owner Type
Purchase Details
Closed on
Oct 31, 2013
Sold by
Macdonald Garry and Macdonald Louisa
Bought by
Macdonald Ft
Current Estimated Value
Home Financials for this Owner
Home Financials are based on the most recent Mortgage that was taken out on this home.
Original Mortgage
$200,000
Outstanding Balance
$151,081
Interest Rate
4.56%
Mortgage Type
Stand Alone Refi Refinance Of Original Loan
Estimated Equity
$426,386
Purchase Details
Closed on
Feb 10, 1995
Sold by
Florenzo Frank T and Florenzo Beverly J
Bought by
Macdonald Garry and Macdonald Louisa
Home Financials for this Owner
Home Financials are based on the most recent Mortgage that was taken out on this home.
Original Mortgage
$68,000
Interest Rate
9.18%
Mortgage Type
Purchase Money Mortgage
Create a Home Valuation Report for This Property
The Home Valuation Report is an in-depth analysis detailing your home's value as well as a comparison with similar homes in the area
Home Values in the Area
Average Home Value in this Area
Purchase History
| Date | Buyer | Sale Price | Title Company |
|---|---|---|---|
| Macdonald Ft | -- | -- | |
| Macdonald Garry | $155,000 | -- |
Source: Public Records
Mortgage History
| Date | Status | Borrower | Loan Amount |
|---|---|---|---|
| Open | Macdonald Ft | $200,000 | |
| Previous Owner | Macdonald Garry | $88,400 | |
| Previous Owner | Macdonald Garry | $18,000 | |
| Previous Owner | Macdonald Garry | $65,000 | |
| Previous Owner | Macdonald Garry | $68,000 |
Source: Public Records
Tax History Compared to Growth
Tax History
| Year | Tax Paid | Tax Assessment Tax Assessment Total Assessment is a certain percentage of the fair market value that is determined by local assessors to be the total taxable value of land and additions on the property. | Land | Improvement |
|---|---|---|---|---|
| 2025 | $5,626 | $425,600 | $224,600 | $201,000 |
| 2024 | $5,499 | $407,000 | $224,600 | $182,400 |
| 2023 | $5,145 | $362,100 | $213,800 | $148,300 |
| 2022 | $5,134 | $353,600 | $204,500 | $149,100 |
| 2021 | $4,879 | $331,000 | $185,900 | $145,100 |
| 2020 | $4,658 | $319,700 | $185,900 | $133,800 |
| 2019 | $4,542 | $309,000 | $177,100 | $131,900 |
| 2018 | $4,426 | $303,800 | $177,100 | $126,700 |
| 2017 | $4,240 | $281,900 | $165,500 | $116,400 |
| 2016 | $4,166 | $281,100 | $159,300 | $121,800 |
| 2015 | $3,933 | $258,900 | $134,500 | $124,400 |
| 2014 | $3,882 | $259,000 | $131,900 | $127,100 |
Source: Public Records
Map
Nearby Homes
- 89 Oak St
- 170 Cannon Forge Dr
- 132 Cannon Forge Dr
- 186 Mechanic St
- 9 Independence Dr Unit 9
- 35 Independence Dr Unit 35
- Lot One Old Wolomolopoag St
- Lot Two Old Wolomolopoag St
- 1 Roseland St Unit A-1
- 12 Community Way
- 1 Eisenhauer Ln
- 14 Winter St Unit B
- 668 S Main St
- 18 Winter St Unit E
- 84 Cocasset St Unit A6
- 630 S Main St
- 91 Old Post Rd
- 97 Old Post Rd
- 14 Foxhill Rd
- 73 Ridge Rd