Estimated Value: $232,000 - $250,000
4
Beds
2
Baths
1,680
Sq Ft
$144/Sq Ft
Est. Value
About This Home
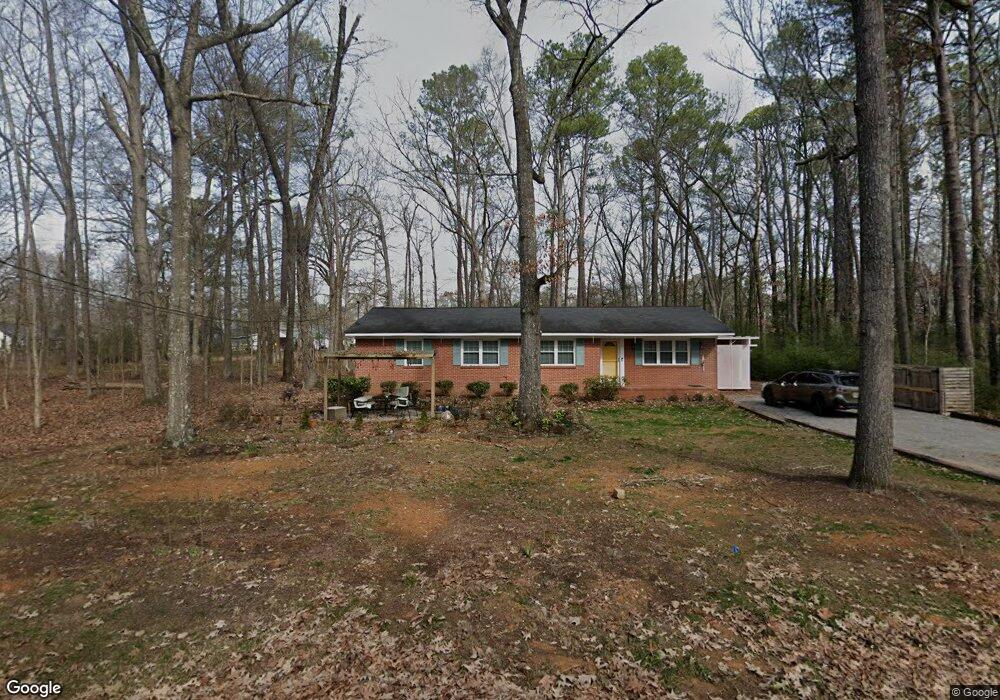
This home is located at 14 Little Dry Creek Rd NW, Rome, GA 30165 and is currently estimated at $242,169, approximately $144 per square foot. 14 Little Dry Creek Rd NW is a home located in Floyd County with nearby schools including Rome High School, St. Mary School, and Darlington School.
Ownership History
Date
Name
Owned For
Owner Type
Purchase Details
Closed on
Oct 24, 2019
Sold by
Mulligan Investments Llc
Bought by
Groce Leslie L and Groce Alison M
Current Estimated Value
Home Financials for this Owner
Home Financials are based on the most recent Mortgage that was taken out on this home.
Original Mortgage
$130,952
Outstanding Balance
$114,721
Interest Rate
3.5%
Mortgage Type
FHA
Estimated Equity
$127,448
Purchase Details
Closed on
Sep 24, 2003
Sold by
Hudgins William and Sharon Hudgins
Bought by
Mulligan Investments Llc
Purchase Details
Closed on
Jun 23, 2003
Sold by
Pearce Joe M
Bought by
Hudgins William and Sharon Hudgins
Purchase Details
Closed on
Jun 25, 1999
Sold by
Storey Dorothy H
Bought by
Pearce Joe M
Purchase Details
Closed on
Feb 17, 1999
Sold by
Storey R O
Bought by
Storey Dorothy H
Purchase Details
Closed on
Jan 10, 1957
Bought by
Storey R O
Create a Home Valuation Report for This Property
The Home Valuation Report is an in-depth analysis detailing your home's value as well as a comparison with similar homes in the area
Home Values in the Area
Average Home Value in this Area
Purchase History
| Date | Buyer | Sale Price | Title Company |
|---|---|---|---|
| Groce Leslie L | $143,000 | -- | |
| Mulligan Investments Llc | -- | -- | |
| Hudgins William | $69,500 | -- | |
| Pearce Joe M | $72,000 | -- | |
| Storey Dorothy H | -- | -- | |
| Storey R O | -- | -- |
Source: Public Records
Mortgage History
| Date | Status | Borrower | Loan Amount |
|---|---|---|---|
| Open | Groce Leslie L | $130,952 |
Source: Public Records
Tax History Compared to Growth
Tax History
| Year | Tax Paid | Tax Assessment Tax Assessment Total Assessment is a certain percentage of the fair market value that is determined by local assessors to be the total taxable value of land and additions on the property. | Land | Improvement |
|---|---|---|---|---|
| 2024 | $3,801 | $99,746 | $8,272 | $91,474 |
| 2023 | $3,532 | $82,666 | $7,520 | $75,146 |
| 2022 | $2,538 | $69,565 | $6,204 | $63,361 |
| 2021 | $2,374 | $63,978 | $6,204 | $57,774 |
| 2020 | $2,140 | $60,083 | $4,700 | $55,383 |
| 2019 | $1,397 | $37,736 | $4,700 | $33,036 |
| 2018 | $1,316 | $35,558 | $4,700 | $30,858 |
| 2017 | $1,269 | $34,272 | $4,700 | $29,572 |
| 2016 | $1,239 | $33,360 | $4,680 | $28,680 |
| 2015 | $1,270 | $33,360 | $4,680 | $28,680 |
| 2014 | $1,270 | $33,360 | $4,680 | $28,680 |
Source: Public Records
Map
Nearby Homes
- 4 Colonial Dr NW
- 204 Oakwood St NW
- 7 Raymond Ave NW
- 0 Unbridled Rd Unit 22 23074684
- 208 Dodd St NW
- 14 Vineland Dr NW
- 1005 N 2nd Ave NW Unit 39
- PEARSON Plan at Shorter Village
- 614 Briarwood Cir NW
- 527 W 11th St NE
- 9 Shorter Cir SW
- 601 W 10th St NE
- 209 Sherwood Rd SW
- 1006 Avenue A NE
- 6 Horseleg Creek Rd SW
- 808 Charlton St NW
- 715 Avenue A NE
- 17 Rosewood Rd SW
- 19 Berckman Ln SW
- 3 Berckman Ln SW
- 0 Little Dry Creek Rd Unit 8640577
- 0 Little Dry Creek Rd
- 6 Walton Way NW
- 7 Walton Way NW
- 101 Oakwood St NW
- 101 Oakwood St NW
- 103 Oakwood St NW
- 105 Oakwood St NW
- 105 Oakwood St NW
- 17 Oakwood St NW
- 107 Oakwood St NW
- 15 Oakwood St NW
- 5 Walton Way NW
- 111 Oakwood St NW
- 109 Oakwood St NW
- 13 Oakwood St NW
- 0 Oakwood St NW
- 11 Oakwood St NW
- 22 Little Dry Creek Rd NW Unit 1-10
- 22 Little Dry Creek Rd NW