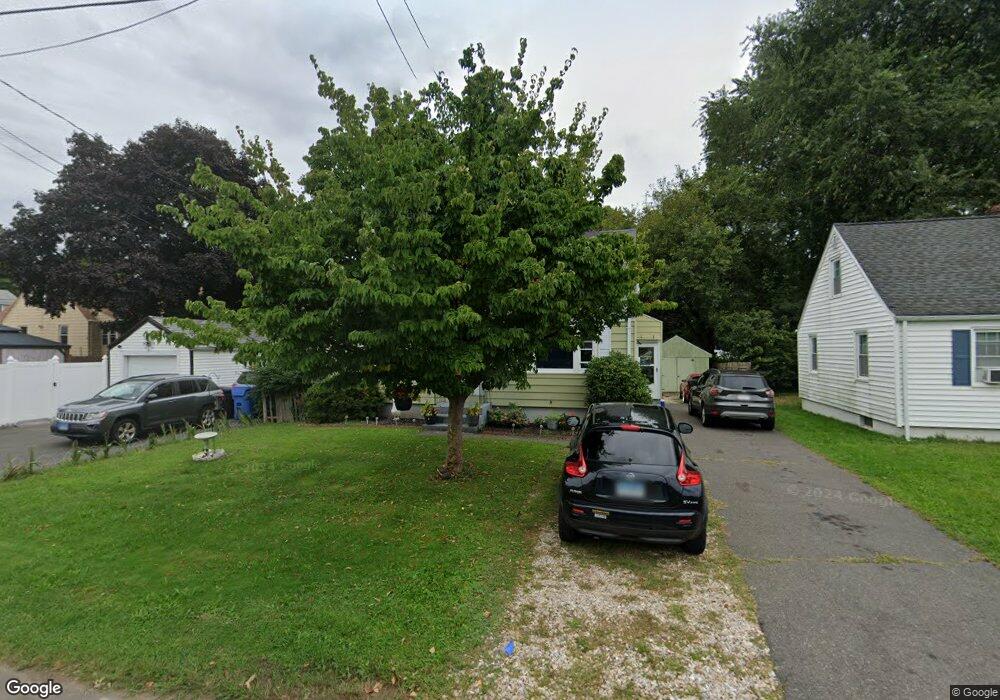
14 Logan St New Britain, CT 06051
Estimated Value: $185,000 - $255,000
3
Beds
1
Bath
1,080
Sq Ft
$201/Sq Ft
Est. Value
About This Home
This home is located at 14 Logan St, New Britain, CT 06051 and is currently estimated at $216,714, approximately $200 per square foot. 14 Logan St is a home located in Hartford County with nearby schools including Vance School, Slade Middle School, and St Paul School.
Ownership History
Date
Name
Owned For
Owner Type
Purchase Details
Closed on
Mar 21, 2022
Sold by
Santiago Carlos and Santiago Marinita
Bought by
Santiago Damita
Current Estimated Value
Home Financials for this Owner
Home Financials are based on the most recent Mortgage that was taken out on this home.
Original Mortgage
$119,047
Outstanding Balance
$111,525
Interest Rate
4.16%
Mortgage Type
FHA
Estimated Equity
$105,189
Purchase Details
Closed on
Nov 20, 1989
Sold by
Vining Michael E
Bought by
Santiago Carlos
Create a Home Valuation Report for This Property
The Home Valuation Report is an in-depth analysis detailing your home's value as well as a comparison with similar homes in the area
Home Values in the Area
Average Home Value in this Area
Purchase History
| Date | Buyer | Sale Price | Title Company |
|---|---|---|---|
| Santiago Damita | $130,000 | None Available | |
| Santiago Carlos | $117,500 | -- |
Source: Public Records
Mortgage History
| Date | Status | Borrower | Loan Amount |
|---|---|---|---|
| Open | Santiago Damita | $119,047 | |
| Previous Owner | Santiago Carlos | $116,000 | |
| Previous Owner | Santiago Carlos | $29,000 | |
| Previous Owner | Santiago Carlos | $108,000 |
Source: Public Records
Tax History Compared to Growth
Tax History
| Year | Tax Paid | Tax Assessment Tax Assessment Total Assessment is a certain percentage of the fair market value that is determined by local assessors to be the total taxable value of land and additions on the property. | Land | Improvement |
|---|---|---|---|---|
| 2025 | $3,936 | $100,450 | $40,880 | $59,570 |
| 2024 | $3,977 | $100,450 | $40,880 | $59,570 |
| 2023 | $3,845 | $100,450 | $40,880 | $59,570 |
| 2022 | $3,465 | $70,000 | $18,830 | $51,170 |
| 2021 | $3,465 | $70,000 | $18,830 | $51,170 |
| 2020 | $3,535 | $70,000 | $18,830 | $51,170 |
| 2019 | $3,535 | $70,000 | $18,830 | $51,170 |
| 2018 | $3,535 | $70,000 | $18,830 | $51,170 |
| 2017 | $3,182 | $63,000 | $17,290 | $45,710 |
| 2016 | $3,182 | $63,000 | $17,290 | $45,710 |
| 2015 | $3,087 | $63,000 | $17,290 | $45,710 |
| 2014 | $3,087 | $63,000 | $17,290 | $45,710 |
Source: Public Records
Map
Nearby Homes