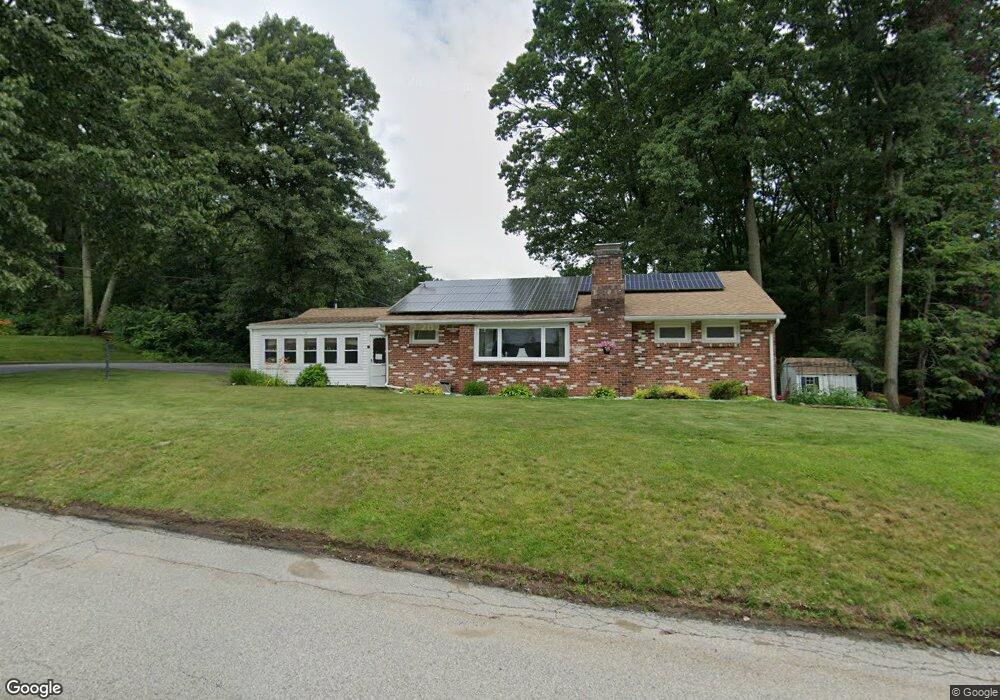
14 Loring St Auburn, MA 01501
Downtown Auburn NeighborhoodEstimated Value: $449,956 - $507,000
3
Beds
2
Baths
1,470
Sq Ft
$322/Sq Ft
Est. Value
About This Home
This home is located at 14 Loring St, Auburn, MA 01501 and is currently estimated at $472,989, approximately $321 per square foot. 14 Loring St is a home located in Worcester County with nearby schools including Auburn Senior High School and Shrewsbury Montessori School - Auburn Campus.
Ownership History
Date
Name
Owned For
Owner Type
Purchase Details
Closed on
May 6, 2008
Sold by
Symonick Steven M
Bought by
Symonick Maura J and Symonick Steven M
Current Estimated Value
Purchase Details
Closed on
Jan 3, 1994
Sold by
Rozanski Alberta
Bought by
Symonick Steven M
Home Financials for this Owner
Home Financials are based on the most recent Mortgage that was taken out on this home.
Original Mortgage
$79,500
Interest Rate
7%
Mortgage Type
Purchase Money Mortgage
Purchase Details
Closed on
Nov 5, 1987
Sold by
Clifford Kevin C
Bought by
Rozanski A
Create a Home Valuation Report for This Property
The Home Valuation Report is an in-depth analysis detailing your home's value as well as a comparison with similar homes in the area
Home Values in the Area
Average Home Value in this Area
Purchase History
| Date | Buyer | Sale Price | Title Company |
|---|---|---|---|
| Symonick Maura J | -- | -- | |
| Symonick Steven M | $106,000 | -- | |
| Rozanski A | $119,000 | -- |
Source: Public Records
Mortgage History
| Date | Status | Borrower | Loan Amount |
|---|---|---|---|
| Open | Rozanski A | $155,000 | |
| Previous Owner | Rozanski A | $79,500 |
Source: Public Records
Tax History
| Year | Tax Paid | Tax Assessment Tax Assessment Total Assessment is a certain percentage of the fair market value that is determined by local assessors to be the total taxable value of land and additions on the property. | Land | Improvement |
|---|---|---|---|---|
| 2025 | $56 | $390,000 | $137,500 | $252,500 |
| 2024 | $5,606 | $375,500 | $130,900 | $244,600 |
| 2023 | $5,402 | $340,200 | $119,000 | $221,200 |
| 2022 | $5,075 | $301,700 | $119,000 | $182,700 |
| 2021 | $5,007 | $276,000 | $105,000 | $171,000 |
| 2020 | $4,962 | $276,000 | $105,000 | $171,000 |
| 2019 | $4,651 | $252,500 | $103,900 | $148,600 |
| 2018 | $4,422 | $239,800 | $97,200 | $142,600 |
| 2017 | $4,231 | $230,700 | $88,100 | $142,600 |
| 2016 | $4,038 | $223,200 | $92,400 | $130,800 |
| 2015 | $3,730 | $216,100 | $92,400 | $123,700 |
| 2014 | $3,536 | $204,500 | $87,900 | $116,600 |
Source: Public Records
Map
Nearby Homes
- 8 South Terrace
- 6 George St
- 61 School St
- 751 Washington St Unit 43A
- 137 South St
- 36 Central St
- 166 Leicester St
- 634 Oxford St S
- 328 Oxford St N
- 35 Waterman Rd
- 33 Eastford Rd
- 31 Walsh Ave
- 31-33 Walsh Ave
- 33 Walsh Ave
- 49 Prospect St
- 40 Bryn Mawr Ave
- 808 Washington St
- 0 Athens St
- 4 Athens St
- 19-20 Williams St
Your Personal Tour Guide
Ask me questions while you tour the home.