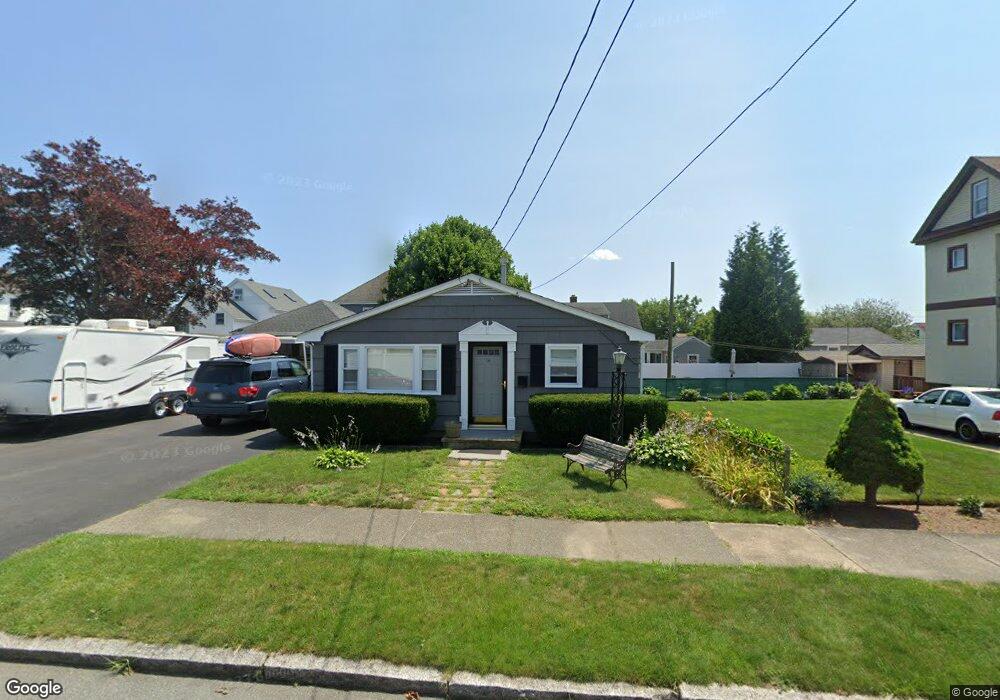
14 Luke St New Bedford, MA 02740
The South End NeighborhoodEstimated Value: $346,559 - $392,000
1
Bed
1
Bath
728
Sq Ft
$508/Sq Ft
Est. Value
About This Home
This home is located at 14 Luke St, New Bedford, MA 02740 and is currently estimated at $369,640, approximately $507 per square foot. 14 Luke St is a home located in Bristol County with nearby schools including Betsey B. Winslow Elementary School, Keith Middle School, and New Bedford High School.
Ownership History
Date
Name
Owned For
Owner Type
Purchase Details
Closed on
Mar 27, 2024
Sold by
Medeiros Jose Est and Medeiros
Bought by
Medeiros Rebecca A
Current Estimated Value
Purchase Details
Closed on
May 11, 1993
Sold by
Neto Eugenio T and Neto Maria A
Bought by
Medeiros Joseph
Create a Home Valuation Report for This Property
The Home Valuation Report is an in-depth analysis detailing your home's value as well as a comparison with similar homes in the area
Home Values in the Area
Average Home Value in this Area
Purchase History
| Date | Buyer | Sale Price | Title Company |
|---|---|---|---|
| Medeiros Rebecca A | -- | None Available | |
| Medeiros Rebecca A | -- | None Available | |
| Medeiros Joseph | $18,000 | -- | |
| Medeiros Joseph | $18,000 | -- |
Source: Public Records
Mortgage History
| Date | Status | Borrower | Loan Amount |
|---|---|---|---|
| Previous Owner | Medeiros Joseph | $25,000 |
Source: Public Records
Tax History Compared to Growth
Tax History
| Year | Tax Paid | Tax Assessment Tax Assessment Total Assessment is a certain percentage of the fair market value that is determined by local assessors to be the total taxable value of land and additions on the property. | Land | Improvement |
|---|---|---|---|---|
| 2025 | $3,331 | $294,500 | $107,100 | $187,400 |
| 2024 | $3,254 | $271,200 | $108,900 | $162,300 |
| 2023 | $3,277 | $229,300 | $93,900 | $135,400 |
| 2022 | $3,004 | $193,300 | $89,300 | $104,000 |
| 2021 | $2,954 | $189,500 | $89,300 | $100,200 |
| 2020 | $2,957 | $183,000 | $89,300 | $93,700 |
| 2019 | $2,930 | $177,900 | $89,300 | $88,600 |
| 2018 | $2,759 | $165,900 | $89,300 | $76,600 |
| 2017 | $2,660 | $159,400 | $89,300 | $70,100 |
| 2016 | $2,520 | $152,800 | $89,300 | $63,500 |
| 2015 | $2,378 | $151,200 | $89,300 | $61,900 |
| 2014 | $2,219 | $146,400 | $83,900 | $62,500 |
Source: Public Records
Map
Nearby Homes