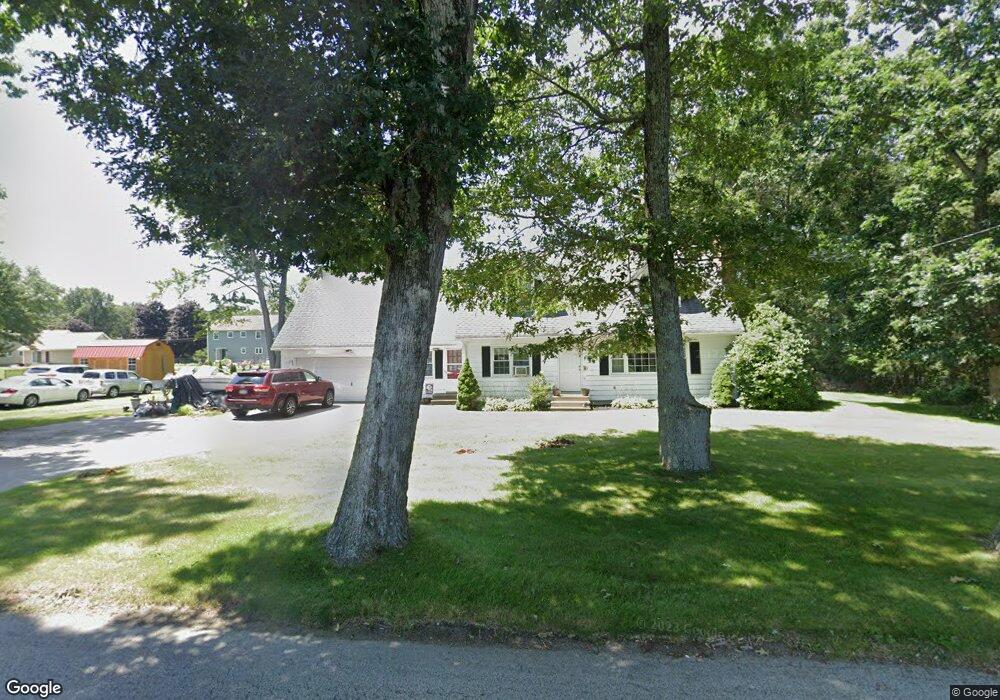
14 Lyons Rd Dudley, MA 01571
Estimated Value: $423,000 - $585,000
4
Beds
2
Baths
2,456
Sq Ft
$195/Sq Ft
Est. Value
About This Home
This home is located at 14 Lyons Rd, Dudley, MA 01571 and is currently estimated at $479,101, approximately $195 per square foot. 14 Lyons Rd is a home located in Worcester County with nearby schools including Shepherd Hill Regional High School, All Saints Academy, and St Joseph School.
Ownership History
Date
Name
Owned For
Owner Type
Purchase Details
Closed on
Mar 30, 2001
Sold by
Dimopoulos George and Dimopoulos Sharon L
Bought by
Gardiner John S and Gardiner Lisa A
Current Estimated Value
Purchase Details
Closed on
Jun 30, 1995
Sold by
Digiovanni Ralph and Digiovanni Paula
Bought by
Dimopoulos George and Dimopoulos Sharon
Create a Home Valuation Report for This Property
The Home Valuation Report is an in-depth analysis detailing your home's value as well as a comparison with similar homes in the area
Home Values in the Area
Average Home Value in this Area
Purchase History
| Date | Buyer | Sale Price | Title Company |
|---|---|---|---|
| Gardiner John S | $215,000 | -- | |
| Dimopoulos George | $149,000 | -- |
Source: Public Records
Mortgage History
| Date | Status | Borrower | Loan Amount |
|---|---|---|---|
| Open | Dimopoulos George | $218,000 | |
| Closed | Dimopoulos George | $196,000 | |
| Closed | Dimopoulos George | $196,000 |
Source: Public Records
Tax History
| Year | Tax Paid | Tax Assessment Tax Assessment Total Assessment is a certain percentage of the fair market value that is determined by local assessors to be the total taxable value of land and additions on the property. | Land | Improvement |
|---|---|---|---|---|
| 2025 | $39 | $367,700 | $77,100 | $290,600 |
| 2024 | $3,607 | $344,200 | $77,100 | $267,100 |
| 2023 | $3,148 | $309,800 | $67,500 | $242,300 |
| 2022 | $3,257 | $278,400 | $66,100 | $212,300 |
| 2021 | $3,114 | $253,200 | $62,600 | $190,600 |
| 2020 | $3,111 | $238,200 | $58,700 | $179,500 |
| 2019 | $3,166 | $234,500 | $58,700 | $175,800 |
| 2018 | $2,645 | $225,500 | $58,700 | $166,800 |
| 2017 | $2,583 | $216,300 | $58,700 | $157,600 |
| 2016 | $2,553 | $209,600 | $55,900 | $153,700 |
| 2015 | $2,539 | $207,100 | $55,900 | $151,200 |
Source: Public Records
Map
Nearby Homes
Your Personal Tour Guide
Ask me questions while you tour the home.