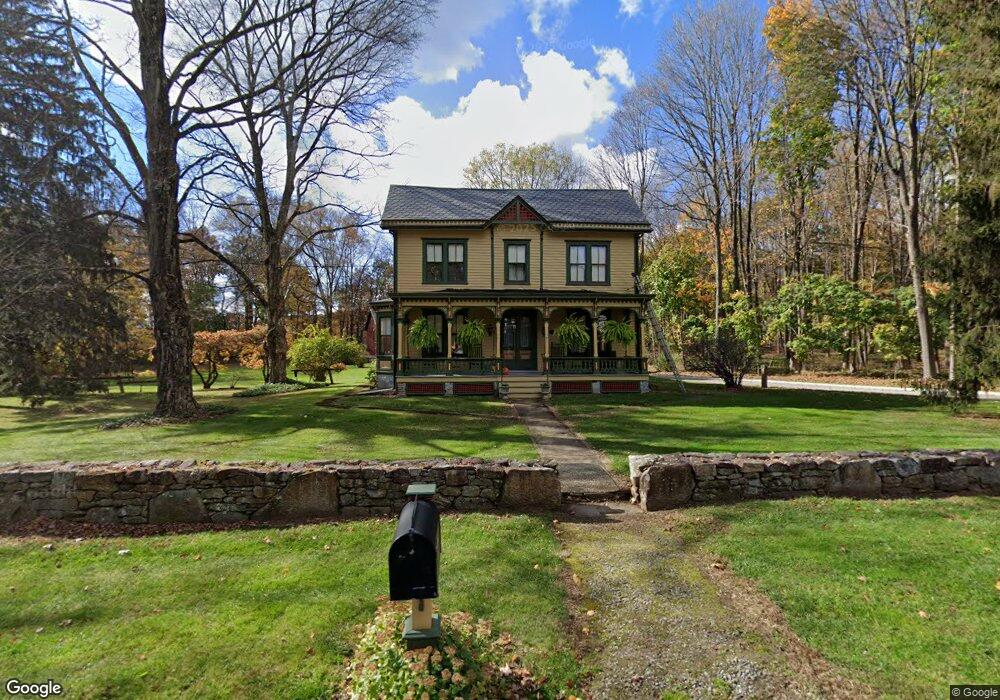
14 Main St Flanders, NJ 07836
Estimated Value: $516,000 - $656,000
Studio
--
Bath
2,155
Sq Ft
$257/Sq Ft
Est. Value
About This Home
This home is located at 14 Main St, Flanders, NJ 07836 and is currently estimated at $553,947, approximately $257 per square foot. 14 Main St is a home located in Morris County with nearby schools including Mt Olive Middle School, Mount Olive High School, and American Christian School.
Ownership History
Date
Name
Owned For
Owner Type
Purchase Details
Closed on
Nov 1, 1997
Sold by
Corcoran Patricia and Corcoran Gregory P
Bought by
Townsley David and Townsley Mary Lynn
Current Estimated Value
Home Financials for this Owner
Home Financials are based on the most recent Mortgage that was taken out on this home.
Original Mortgage
$120,000
Outstanding Balance
$19,659
Interest Rate
7.26%
Estimated Equity
$534,288
Purchase Details
Closed on
Mar 11, 1997
Sold by
Oke Robert and Oak Robert
Bought by
Corcoran Patricia and Oak John B
Create a Home Valuation Report for This Property
The Home Valuation Report is an in-depth analysis detailing your home's value as well as a comparison with similar homes in the area
Home Values in the Area
Average Home Value in this Area
Purchase History
| Date | Buyer | Sale Price | Title Company |
|---|---|---|---|
| Townsley David | $170,000 | -- | |
| Corcoran Patricia | -- | -- |
Source: Public Records
Mortgage History
| Date | Status | Borrower | Loan Amount |
|---|---|---|---|
| Open | Townsley David | $120,000 |
Source: Public Records
Tax History
| Year | Tax Paid | Tax Assessment Tax Assessment Total Assessment is a certain percentage of the fair market value that is determined by local assessors to be the total taxable value of land and additions on the property. | Land | Improvement |
|---|---|---|---|---|
| 2025 | $10,622 | $304,800 | $149,900 | $154,900 |
| 2024 | $10,019 | $304,800 | $149,900 | $154,900 |
Source: Public Records
Map
Nearby Homes
Your Personal Tour Guide
Ask me questions while you tour the home.