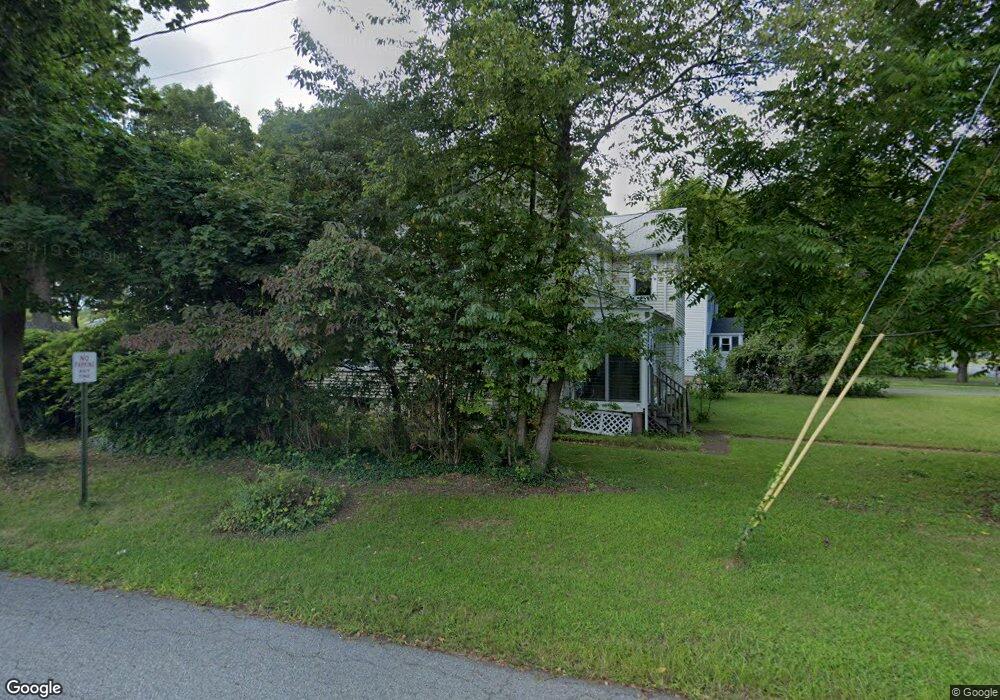
14 Main St Succasunna, NJ 07876
Estimated Value: $507,000 - $605,000
Studio
--
Bath
2,194
Sq Ft
$251/Sq Ft
Est. Value
About This Home
This home is located at 14 Main St, Succasunna, NJ 07876 and is currently estimated at $550,413, approximately $250 per square foot. 14 Main St is a home located in Morris County with nearby schools including Eisenhower Middle School, Lincoln Roosevelt Elementary School, and Roxbury High School.
Ownership History
Date
Name
Owned For
Owner Type
Purchase Details
Closed on
Sep 25, 1998
Sold by
Federal Home Loan Mortgage Corporation
Bought by
Guirgis Fathi A and Guirgis Amal
Current Estimated Value
Home Financials for this Owner
Home Financials are based on the most recent Mortgage that was taken out on this home.
Original Mortgage
$106,500
Outstanding Balance
$23,116
Interest Rate
6.8%
Estimated Equity
$527,297
Purchase Details
Closed on
Jul 16, 1998
Sold by
Beebe Michael E and Beebe Patricia A
Bought by
Federal Home Loan Mortgage Corporation
Create a Home Valuation Report for This Property
The Home Valuation Report is an in-depth analysis detailing your home's value as well as a comparison with similar homes in the area
Home Values in the Area
Average Home Value in this Area
Purchase History
| Date | Buyer | Sale Price | Title Company |
|---|---|---|---|
| Guirgis Fathi A | $142,000 | -- | |
| Federal Home Loan Mortgage Corporation | -- | -- |
Source: Public Records
Mortgage History
| Date | Status | Borrower | Loan Amount |
|---|---|---|---|
| Open | Guirgis Fathi A | $106,500 |
Source: Public Records
Tax History
| Year | Tax Paid | Tax Assessment Tax Assessment Total Assessment is a certain percentage of the fair market value that is determined by local assessors to be the total taxable value of land and additions on the property. | Land | Improvement |
|---|---|---|---|---|
| 2025 | $7,763 | $282,400 | $81,500 | $200,900 |
| 2024 | $7,642 | $282,400 | $81,500 | $200,900 |
Source: Public Records
Map
Nearby Homes
- 51 Main St Succ
- 8 Kenvil Ave
- 1581 Sussex Turnpike
- 1128 Route 10
- 54 Mapledale Ave
- 33 N Hillside Ave
- 2 Chase Dr Unit 2-4
- 2 Norman Ln
- 56 N Hillside Ave
- 15 Janet Dr
- 238 Drake Ln Unit 238
- 198 Drake Ln Unit 198
- 7 Drake Ln
- 119 Woods Edge Dr Unit 119
- 6 Alwood Ln
- 894 Route46ken
- 15 Melissa Ln
- 24 Rivendell Rd
- 56 Woods Edge Dr
- 30 Woods Edge Dr
Your Personal Tour Guide
Ask me questions while you tour the home.