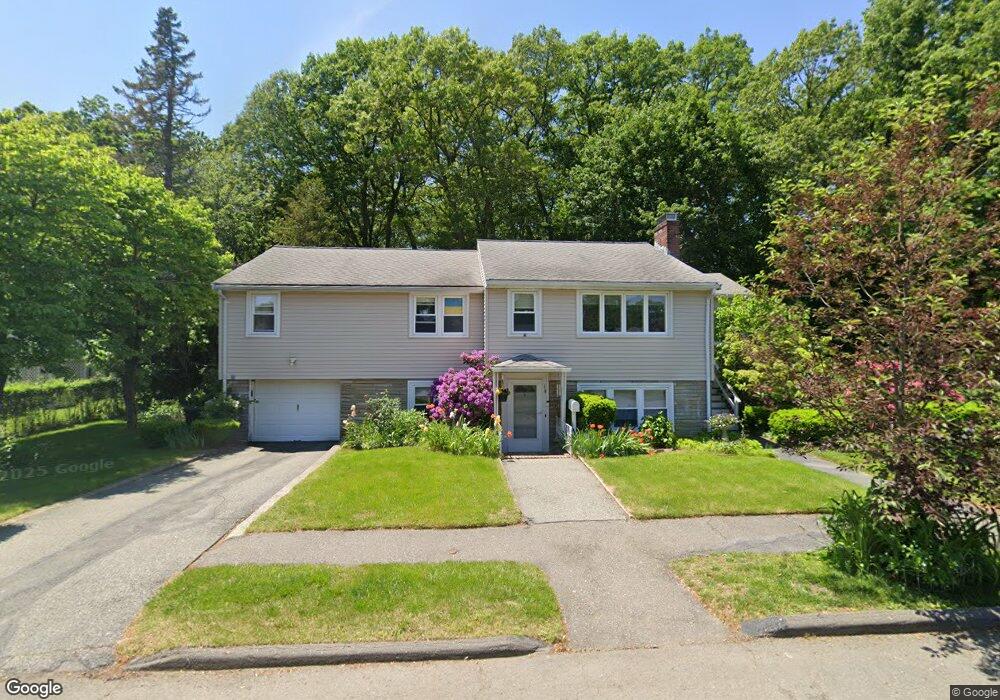
14 Mansfield St Peabody, MA 01960
South Peabody NeighborhoodEstimated Value: $731,112 - $818,000
3
Beds
3
Baths
2,008
Sq Ft
$386/Sq Ft
Est. Value
About This Home
This home is located at 14 Mansfield St, Peabody, MA 01960 and is currently estimated at $774,528, approximately $385 per square foot. 14 Mansfield St is a home located in Essex County with nearby schools including Peabody Veterans Memorial High School and Our Lady Of Assumption School.
Ownership History
Date
Name
Owned For
Owner Type
Purchase Details
Closed on
Aug 1, 1984
Bought by
14 Mansfield St T
Current Estimated Value
Create a Home Valuation Report for This Property
The Home Valuation Report is an in-depth analysis detailing your home's value as well as a comparison with similar homes in the area
Home Values in the Area
Average Home Value in this Area
Purchase History
We collect this data history from publicly available records. To have your information removed, we recommend requesting removal directly through your county’s website.
| Date | Buyer | Sale Price | Title Company |
|---|---|---|---|
| 14 Mansfield St T | $107,000 | -- |
Source: Public Records
Mortgage History
We collect this data history from publicly available records. To have your information removed, we recommend requesting removal directly through your county’s website.
| Date | Status | Borrower | Loan Amount |
|---|---|---|---|
| Open | 14 Mansfield St T | $27,000 | |
| Open | 14 Mansfield St T | $74,000 | |
| Closed | 14 Mansfield St T | $65,000 | |
| Closed | 14 Mansfield St T | $67,000 |
Source: Public Records
Tax History
| Year | Tax Paid | Tax Assessment Tax Assessment Total Assessment is a certain percentage of the fair market value that is determined by local assessors to be the total taxable value of land and additions on the property. | Land | Improvement |
|---|---|---|---|---|
| 2025 | $6,033 | $651,500 | $243,500 | $408,000 |
| 2024 | $5,591 | $613,000 | $243,500 | $369,500 |
| 2023 | $5,481 | $575,700 | $217,400 | $358,300 |
| 2022 | $5,058 | $500,800 | $194,200 | $306,600 |
| 2021 | $4,874 | $464,600 | $176,500 | $288,100 |
| 2020 | $5,138 | $478,400 | $176,500 | $301,900 |
| 2019 | $4,937 | $448,400 | $176,500 | $271,900 |
| 2018 | $4,567 | $398,500 | $160,500 | $238,000 |
| 2017 | $4,680 | $398,000 | $160,500 | $237,500 |
| 2016 | $4,168 | $349,700 | $160,500 | $189,200 |
| 2015 | $4,336 | $352,500 | $156,500 | $196,000 |
Source: Public Records
Map
Nearby Homes
- 12 Mansfield St
- 1100 Salem St Unit 65
- 25 Cumberland Rd
- 836 Lynnfield St
- 900 Lynnfield St Unit 37
- 900 Lynnfield St Unit D16
- 57 Cumberland Cir
- 60r Lynnbrook Rd
- 714 Lynnfield St
- 7 Nells Pond Rd
- 196 Bartholomew St
- 255 Cedar Brook Rd
- 428 Broadway
- 741 Salem St
- 38 Sandra Rd
- 344 Broadway
- 67 Brook Dr
- 18 Gedney Dr
- 2 Carpenter Rd
- 4203 Woodbridge Rd Unit 4203
Your Personal Tour Guide
Ask me questions while you tour the home.