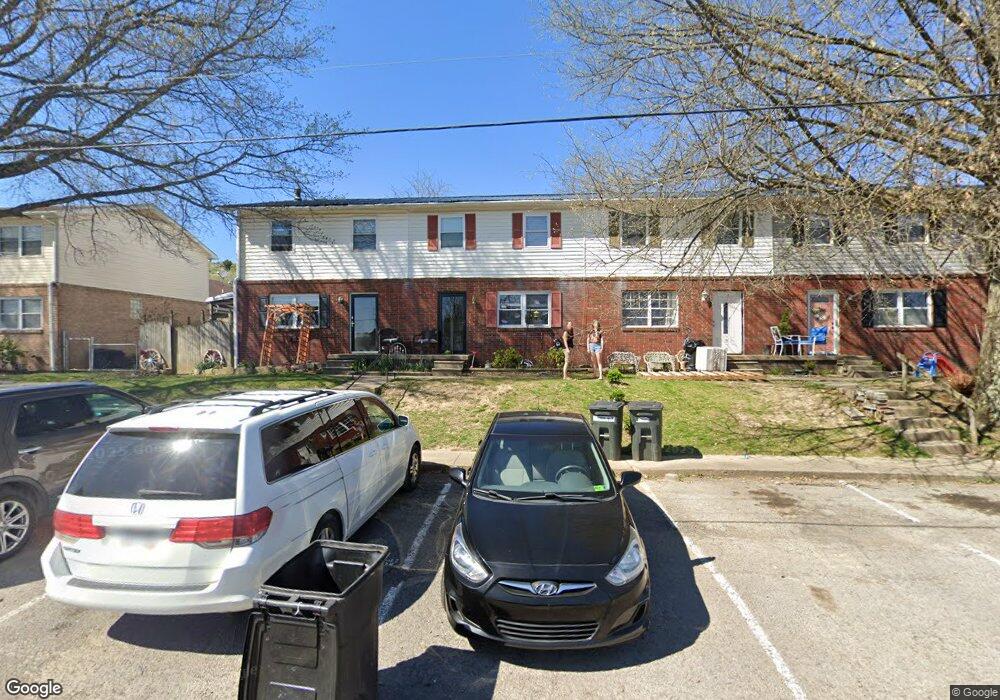
14 Marcus Dr Morgantown, WV 26501
Estimated Value: $130,000 - $146,000
3
Beds
1
Bath
1,080
Sq Ft
$130/Sq Ft
Est. Value
About This Home
This home is located at 14 Marcus Dr, Morgantown, WV 26501 and is currently estimated at $140,686, approximately $130 per square foot. 14 Marcus Dr is a home located in Monongalia County with nearby schools including Mountainview Elementary School, South Middle School, and Morgantown High School.
Ownership History
Date
Name
Owned For
Owner Type
Purchase Details
Closed on
Sep 30, 2019
Sold by
Larew Glenn C
Bought by
Roach Michael A and Roach Rachel L
Current Estimated Value
Home Financials for this Owner
Home Financials are based on the most recent Mortgage that was taken out on this home.
Original Mortgage
$69,750
Outstanding Balance
$45,774
Interest Rate
3.5%
Mortgage Type
New Conventional
Estimated Equity
$94,912
Purchase Details
Closed on
Aug 7, 2017
Sold by
Hogan Benjamin J and Hogan Janice K
Bought by
Larew Glenn C
Purchase Details
Closed on
Jul 15, 2014
Sold by
Hogan Janice K
Bought by
Hogan Janice K and Hogan Benjamin J
Purchase Details
Closed on
Apr 4, 2007
Sold by
Walden Richard B and Walden Betty W
Bought by
Hogan Douglas E and Hogan Janice K
Home Financials for this Owner
Home Financials are based on the most recent Mortgage that was taken out on this home.
Original Mortgage
$70,000
Interest Rate
6.21%
Mortgage Type
New Conventional
Create a Home Valuation Report for This Property
The Home Valuation Report is an in-depth analysis detailing your home's value as well as a comparison with similar homes in the area
Home Values in the Area
Average Home Value in this Area
Purchase History
| Date | Buyer | Sale Price | Title Company |
|---|---|---|---|
| Roach Michael A | $77,500 | None Available | |
| Larew Glenn C | $75,000 | None Available | |
| Hogan Janice K | -- | None Available | |
| Hogan Douglas E | $75,500 | None Available |
Source: Public Records
Mortgage History
| Date | Status | Borrower | Loan Amount |
|---|---|---|---|
| Open | Roach Michael A | $69,750 | |
| Previous Owner | Hogan Douglas E | $70,000 |
Source: Public Records
Tax History Compared to Growth
Tax History
| Year | Tax Paid | Tax Assessment Tax Assessment Total Assessment is a certain percentage of the fair market value that is determined by local assessors to be the total taxable value of land and additions on the property. | Land | Improvement |
|---|---|---|---|---|
| 2025 | $422 | $39,480 | $7,260 | $32,220 |
| 2024 | $422 | $39,960 | $7,260 | $32,700 |
| 2023 | $426 | $39,960 | $7,260 | $32,700 |
| 2022 | $403 | $39,360 | $7,260 | $32,100 |
| 2021 | $425 | $41,280 | $7,260 | $34,020 |
| 2020 | $427 | $41,280 | $7,260 | $34,020 |
| 2019 | $869 | $41,700 | $7,260 | $34,440 |
| 2018 | $872 | $41,700 | $7,260 | $34,440 |
| 2017 | $439 | $41,760 | $6,840 | $34,920 |
| 2016 | $442 | $41,760 | $6,840 | $34,920 |
| 2015 | $422 | $41,700 | $6,240 | $35,460 |
| 2014 | $395 | $40,920 | $5,940 | $34,980 |
Source: Public Records
Map
Nearby Homes
- 124 Kaustin Dr
- 57 Hewstone Ct
- 103 Apolla Dr
- 248 Stonehurst Dr
- 242 Stonehurst Dr
- 1311 Dorsey Ave
- Lot 28 S Point Cir
- Lots 20 + 21 S Point Cir
- Lot 45 Courtney Ave
- 00 Stonehurst Dr
- 405 Cimarron Place
- TBD Huntington Ave
- 108 Village Crest Dr
- TBD Charleston Ave
- 763 S Hills Dr
- 0 Buckhannon Ave
- 0 Cooper St
- 975 Dorsey Ave
- 200 Webster Ave
- TBD Karen Ln