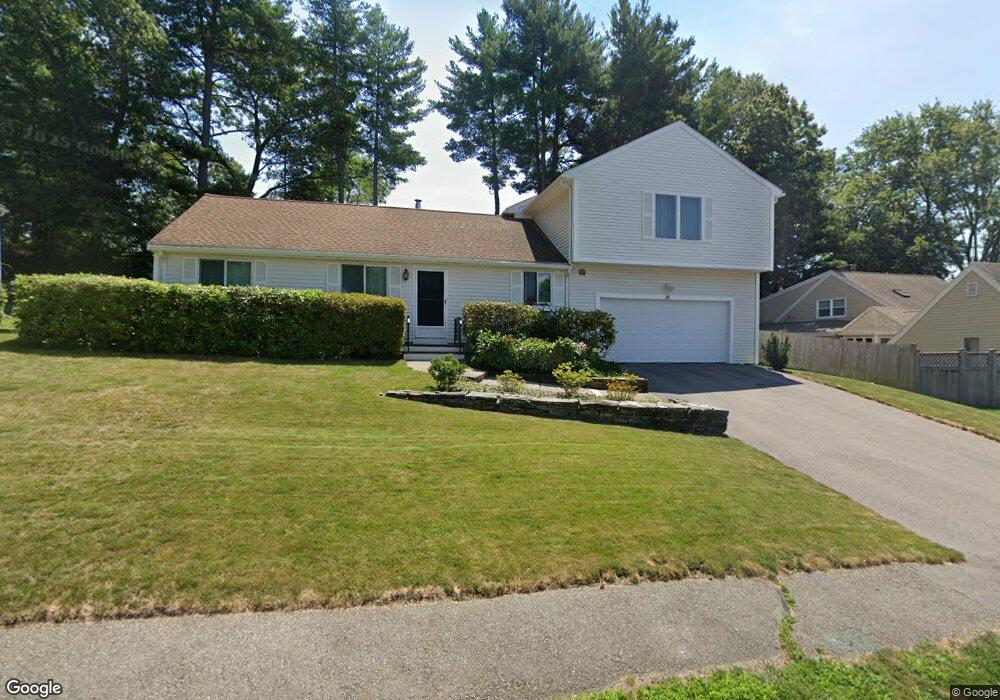
14 Mary Chilton Rd Needham, MA 02492
Estimated Value: $1,146,000 - $1,692,148
5
Beds
4
Baths
1,204
Sq Ft
$1,248/Sq Ft
Est. Value
About This Home
This home is located at 14 Mary Chilton Rd, Needham, MA 02492 and is currently estimated at $1,502,787, approximately $1,248 per square foot. 14 Mary Chilton Rd is a home located in Norfolk County with nearby schools including Newman Elementary School, High Rock Middle School, and Pollard Middle School.
Ownership History
Date
Name
Owned For
Owner Type
Purchase Details
Closed on
Aug 11, 2020
Sold by
Chen Changmin and Xie Yue
Bought by
Xie Chen Ft and Chen
Current Estimated Value
Purchase Details
Closed on
Jun 25, 1997
Sold by
Goldberg Edward A and Goldberg Beverly A
Bought by
Jopling John P
Home Financials for this Owner
Home Financials are based on the most recent Mortgage that was taken out on this home.
Original Mortgage
$135,000
Interest Rate
7.81%
Mortgage Type
Purchase Money Mortgage
Purchase Details
Closed on
Jul 9, 1992
Sold by
Greenstein Gary L
Bought by
Goldberg Edward A and Goldberg Beverly A
Create a Home Valuation Report for This Property
The Home Valuation Report is an in-depth analysis detailing your home's value as well as a comparison with similar homes in the area
Home Values in the Area
Average Home Value in this Area
Purchase History
| Date | Buyer | Sale Price | Title Company |
|---|---|---|---|
| Xie Chen Ft | -- | None Available | |
| Xie Chen Ft | -- | None Available | |
| Jopling John P | $225,000 | -- | |
| Jopling John P | $225,000 | -- | |
| Goldberg Edward A | $192,000 | -- | |
| Goldberg Edward A | $192,000 | -- |
Source: Public Records
Mortgage History
| Date | Status | Borrower | Loan Amount |
|---|---|---|---|
| Previous Owner | Goldberg Edward A | $250,000 | |
| Previous Owner | Goldberg Edward A | $300,000 | |
| Previous Owner | Goldberg Edward A | $135,000 |
Source: Public Records
Tax History Compared to Growth
Tax History
| Year | Tax Paid | Tax Assessment Tax Assessment Total Assessment is a certain percentage of the fair market value that is determined by local assessors to be the total taxable value of land and additions on the property. | Land | Improvement |
|---|---|---|---|---|
| 2025 | $14,276 | $1,346,800 | $719,000 | $627,800 |
| 2024 | $12,466 | $995,700 | $490,300 | $505,400 |
| 2023 | $12,118 | $929,300 | $490,300 | $439,000 |
| 2022 | $11,463 | $857,400 | $438,000 | $419,400 |
| 2021 | $8,700 | $667,700 | $438,000 | $229,700 |
| 2020 | $7,355 | $588,900 | $438,000 | $150,900 |
| 2019 | $6,762 | $545,800 | $398,400 | $147,400 |
| 2018 | $6,484 | $545,800 | $398,400 | $147,400 |
| 2017 | $6,290 | $529,000 | $398,400 | $130,600 |
| 2016 | $6,123 | $530,600 | $398,400 | $132,200 |
| 2015 | $5,990 | $530,600 | $398,400 | $132,200 |
| 2014 | $5,519 | $474,100 | $346,700 | $127,400 |
Source: Public Records
Map
Nearby Homes
- 98 Great Plain Ave
- 93 Seaver St
- 94 Rice St
- 46 Lincoln Rd
- 32 Twitchell St
- 14 Twitchell St
- 29 Tolman St
- 9 Hampden St
- 17 Atwood St
- 28 Clovelly Rd
- 34 Pershing Rd
- 29 Cottage St
- 78 Pheasant Landing Rd
- 37 Carleton Dr
- 609 Washington St Unit 303
- 32 Kingsbury St Unit A
- 29 Rockland St
- 98 Hunnewell St
- 5 Abbott St
- 100 Linden St Unit 111
- 22 Mary Chilton Rd
- 7 Powder House Cir
- 11 Powder House Cir
- 11 Powder House Cir Unit 11
- 15 Powder House Cir
- 28 Mary Chilton Rd
- 17 Mary Chilton Rd
- 11 Mary Chilton Rd
- 1 Powder House Cir
- 3 Mary Chilton Rd
- 25 Mary Chilton Rd
- 21 Powder House Cir
- 29 Mary Chilton Rd
- 40 Mary Chilton Rd
- 6 Powder House Cir
- 37 Mary Chilton Rd
- 27 Powder House Cir
- 14 Powder House Cir
- 18 Powder House Cir
- 48 Mary Chilton Rd