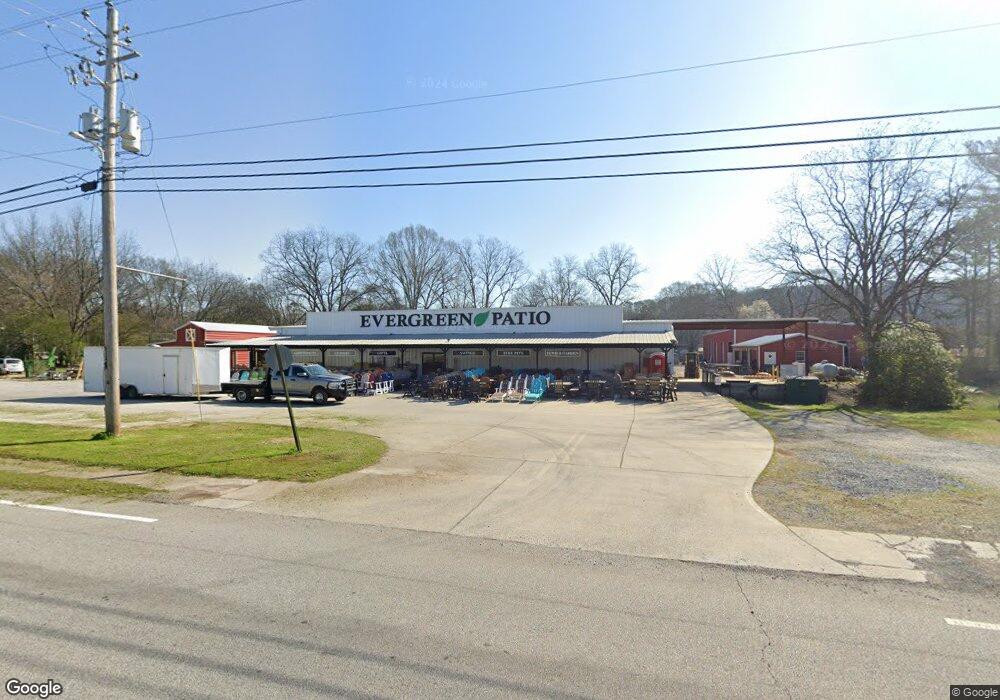
14 Mill St SW Cave Spring, GA 30124
Estimated Value: $721,802
--
Bed
--
Bath
3,000
Sq Ft
$241/Sq Ft
Est. Value
About This Home
This home is located at 14 Mill St SW, Cave Spring, GA 30124 and is currently estimated at $721,802, approximately $240 per square foot. 14 Mill St SW is a home located in Floyd County with nearby schools including Coosa Middle School and Coosa High School.
Ownership History
Date
Name
Owned For
Owner Type
Purchase Details
Closed on
Aug 6, 2018
Sold by
Scott Kinney
Bought by
Evergreen Patio Corp
Current Estimated Value
Purchase Details
Closed on
Mar 6, 2009
Sold by
Cave Spring Hardware Inc
Bought by
Kinney Joseph Scott
Purchase Details
Closed on
Jun 11, 1997
Sold by
Rucker Jerry
Bought by
Cave Spring Hardware Inc
Purchase Details
Closed on
Jun 11, 1996
Bought by
P and R
Purchase Details
Closed on
Mar 31, 1994
Sold by
Rucker Jerry and Nancy Jane Culver
Bought by
Rucker Jerry
Purchase Details
Closed on
Nov 5, 1993
Bought by
P and R
Purchase Details
Closed on
Jan 11, 1990
Sold by
Casey Frank L
Bought by
Rucker Jerry and Nancy Jane Culver
Purchase Details
Closed on
Jun 8, 1982
Sold by
Casey Frank L and Pauline Nicholson Casey
Bought by
Casey Frank L
Purchase Details
Closed on
Mar 17, 1970
Sold by
Casey Casey A and Casey Frank L
Bought by
Casey Frank L and Pauline Nicholson C
Purchase Details
Closed on
Jan 1, 1949
Bought by
Casey Casey A and Casey Frank L
Create a Home Valuation Report for This Property
The Home Valuation Report is an in-depth analysis detailing your home's value as well as a comparison with similar homes in the area
Home Values in the Area
Average Home Value in this Area
Purchase History
| Date | Buyer | Sale Price | Title Company |
|---|---|---|---|
| Evergreen Patio Corp | $345,000 | -- | |
| Kinney Joseph Scott | $170,000 | -- | |
| Cave Spring Hardware Inc | $82,000 | -- | |
| P | -- | -- | |
| Rucker Jerry | $12,500 | -- | |
| P | -- | -- | |
| Rucker Jerry | $23,000 | -- | |
| Casey Frank L | -- | -- | |
| Casey Frank L | -- | -- | |
| Casey Casey A | -- | -- |
Source: Public Records
Tax History Compared to Growth
Tax History
| Year | Tax Paid | Tax Assessment Tax Assessment Total Assessment is a certain percentage of the fair market value that is determined by local assessors to be the total taxable value of land and additions on the property. | Land | Improvement |
|---|---|---|---|---|
| 2024 | $2,462 | $93,896 | $40,160 | $53,736 |
| 2023 | $2,470 | $82,404 | $40,160 | $42,244 |
| 2022 | $1,982 | $72,414 | $34,423 | $37,991 |
| 2021 | $1,763 | $63,230 | $34,423 | $28,807 |
| 2020 | $1,780 | $63,262 | $34,423 | $28,839 |
| 2019 | $1,745 | $62,929 | $34,423 | $28,506 |
| 2018 | $1,758 | $63,286 | $34,423 | $28,863 |
| 2017 | $1,772 | $63,643 | $34,423 | $29,220 |
| 2016 | $1,805 | $64,056 | $34,400 | $29,656 |
| 2015 | $1,762 | $64,056 | $34,400 | $29,656 |
| 2014 | $1,762 | $64,056 | $34,400 | $29,656 |
Source: Public Records
Map
Nearby Homes
- 22 River St SW
- 7 Herschel Mize Dr SW
- 7 Herschel Mize Dr
- 104 Fincher St
- 57 Mill St
- 5677 Fosters Mill Rd SW
- 5598 Fosters Mill Rd
- 0 Mill Rd Unit 10629874
- 0 Mill Rd Unit 7670319
- 10 Ridge Rd SW
- 8876 Cave Spring Rd SW
- 8876 Cave Spring
- 0 Melson Rd SW Unit 7676052
- 0 Melson Rd SW Unit 10636997
- 907 Gadsden Rd SW
- 123 Santa Claus Rd
- 424 Michael Blvd
- 383 Valley Grove Rd
- 100 Lee Ave
- 0 McGee Bend Rd SW Unit 10351960