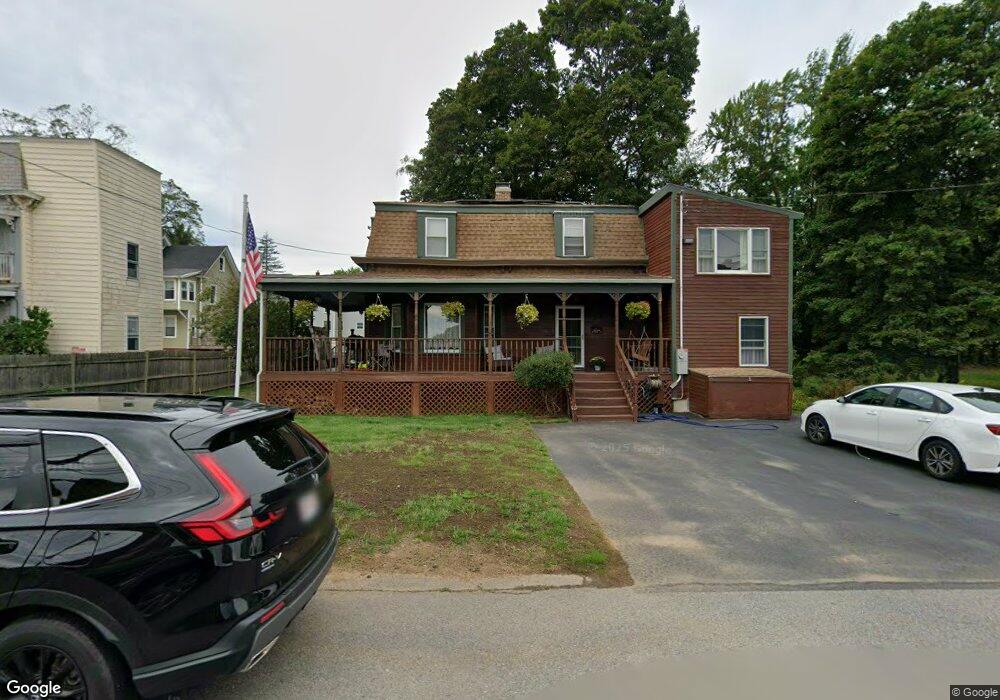
14 Murdock Ave Winchendon, MA 01475
Estimated Value: $381,449 - $424,000
5
Beds
2
Baths
2,704
Sq Ft
$149/Sq Ft
Est. Value
About This Home
This home is located at 14 Murdock Ave, Winchendon, MA 01475 and is currently estimated at $403,112, approximately $149 per square foot. 14 Murdock Ave is a home located in Worcester County with nearby schools including Toy Town Elementary School, Memorial, and The Winchendon School.
Ownership History
Date
Name
Owned For
Owner Type
Purchase Details
Closed on
Jul 23, 2001
Sold by
Bowen William L and Bowen Teresa G
Bought by
Michaud David and Michaud Cynthia J
Current Estimated Value
Purchase Details
Closed on
Aug 18, 1998
Sold by
Graw Victoria
Bought by
Bowen Williaml and Bowen Teresa G
Purchase Details
Closed on
Oct 6, 1995
Sold by
Fnma
Bought by
Kling Neal F and Graw Victoria
Purchase Details
Closed on
Jun 6, 1994
Sold by
Rossignol Cary D
Bought by
Athol Sb
Create a Home Valuation Report for This Property
The Home Valuation Report is an in-depth analysis detailing your home's value as well as a comparison with similar homes in the area
Home Values in the Area
Average Home Value in this Area
Purchase History
| Date | Buyer | Sale Price | Title Company |
|---|---|---|---|
| Michaud David | $145,000 | -- | |
| Michaud David | $145,000 | -- | |
| Bowen Williaml | $93,000 | -- | |
| Bowen Williaml | $93,000 | -- | |
| Kling Neal F | $53,900 | -- | |
| Kling Neal F | $53,900 | -- | |
| Athol Sb | $78,609 | -- | |
| Athol Sb | $78,609 | -- |
Source: Public Records
Mortgage History
| Date | Status | Borrower | Loan Amount |
|---|---|---|---|
| Open | Athol Sb | $160,000 | |
| Closed | Athol Sb | $150,000 |
Source: Public Records
Tax History Compared to Growth
Tax History
| Year | Tax Paid | Tax Assessment Tax Assessment Total Assessment is a certain percentage of the fair market value that is determined by local assessors to be the total taxable value of land and additions on the property. | Land | Improvement |
|---|---|---|---|---|
| 2025 | $3,536 | $300,900 | $30,200 | $270,700 |
| 2024 | $3,535 | $281,900 | $29,000 | $252,900 |
| 2023 | $3,434 | $256,300 | $28,300 | $228,000 |
| 2022 | $3,663 | $242,400 | $35,700 | $206,700 |
| 2021 | $3,605 | $229,300 | $32,500 | $196,800 |
| 2020 | $3,376 | $207,400 | $30,200 | $177,200 |
| 2019 | $3,297 | $197,300 | $28,000 | $169,300 |
| 2018 | $3,253 | $187,500 | $26,100 | $161,400 |
| 2017 | $3,330 | $185,300 | $31,700 | $153,600 |
| 2016 | $3,193 | $183,200 | $30,200 | $153,000 |
| 2015 | $3,063 | $183,200 | $30,200 | $153,000 |
| 2014 | $2,857 | $179,000 | $31,900 | $147,100 |
Source: Public Records
Map
Nearby Homes