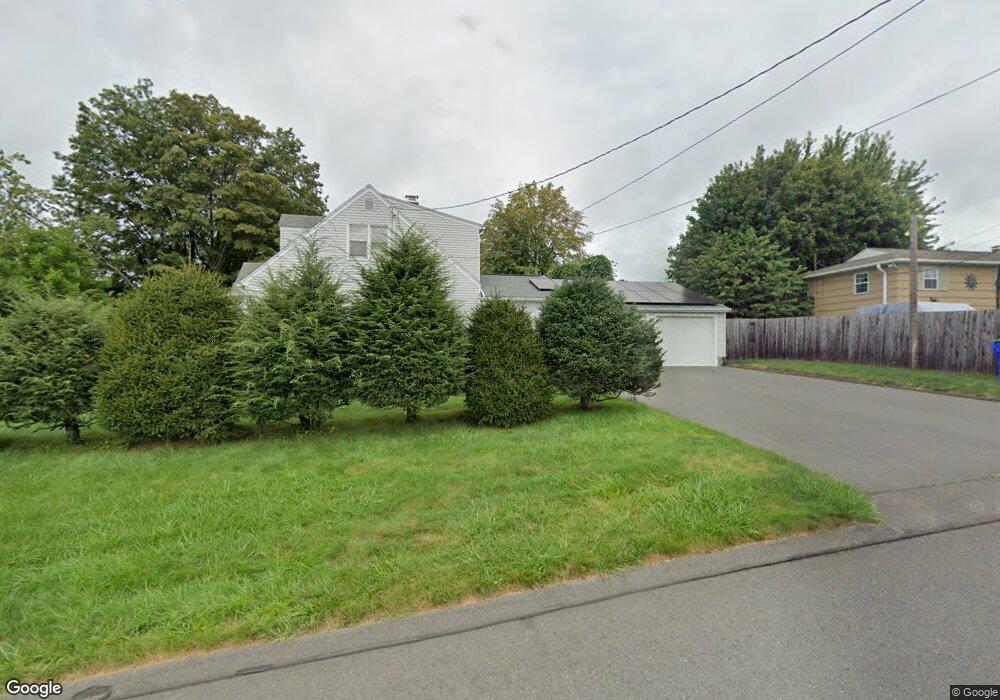
14 N Farms Rd 1 Other City - Not In the State of Florida, CT 06001
Estimated Value: $700,000 - $834,000
3
Beds
3
Baths
3,500
Sq Ft
$211/Sq Ft
Est. Value
About This Home
This home is located at 14 N Farms Rd 1, Other City - Not In the State of Florida, CT 06001 and is currently estimated at $737,087, approximately $210 per square foot. 14 N Farms Rd 1 is a home located in Hartford County with nearby schools including Pine Grove School, Thompson Brook School, and Avon Middle School.
Ownership History
Date
Name
Owned For
Owner Type
Purchase Details
Closed on
Jan 20, 2017
Sold by
Finch Justin J and Finch Amy M
Bought by
Finch Ft
Current Estimated Value
Purchase Details
Closed on
Nov 9, 2012
Sold by
Guedez Nestor and Otero Bienvenida
Bought by
Finch Justin J and Finch Amy M
Home Financials for this Owner
Home Financials are based on the most recent Mortgage that was taken out on this home.
Original Mortgage
$396,000
Interest Rate
3.42%
Purchase Details
Closed on
Nov 10, 2009
Sold by
Powell Jason and Powell Lucky
Bought by
Guedez Nester and Otero Blenvenida
Home Financials for this Owner
Home Financials are based on the most recent Mortgage that was taken out on this home.
Original Mortgage
$356,800
Interest Rate
5.06%
Purchase Details
Closed on
Dec 17, 2001
Sold by
Golia Rasaria P
Bought by
Powell Jason and Powell Lucky
Create a Home Valuation Report for This Property
The Home Valuation Report is an in-depth analysis detailing your home's value as well as a comparison with similar homes in the area
Home Values in the Area
Average Home Value in this Area
Purchase History
| Date | Buyer | Sale Price | Title Company |
|---|---|---|---|
| Finch Ft | -- | -- | |
| Finch Ft | -- | -- | |
| Finch Justin J | $440,000 | -- | |
| Finch Justin J | $440,000 | -- | |
| Guedez Nester | $446,000 | -- | |
| Guedez Nester | $446,000 | -- | |
| Powell Jason | $362,000 | -- | |
| Powell Jason | $362,000 | -- |
Source: Public Records
Mortgage History
| Date | Status | Borrower | Loan Amount |
|---|---|---|---|
| Previous Owner | Finch Justin J | $396,000 | |
| Previous Owner | Powell Jason | $356,800 |
Source: Public Records
Tax History Compared to Growth
Tax History
| Year | Tax Paid | Tax Assessment Tax Assessment Total Assessment is a certain percentage of the fair market value that is determined by local assessors to be the total taxable value of land and additions on the property. | Land | Improvement |
|---|---|---|---|---|
| 2025 | $11,855 | $385,520 | $126,230 | $259,290 |
| 2024 | $11,435 | $385,520 | $126,230 | $259,290 |
| 2023 | $10,345 | $292,320 | $98,230 | $194,090 |
| 2022 | $10,117 | $292,320 | $98,230 | $194,090 |
| 2021 | $10,000 | $292,320 | $98,230 | $194,090 |
| 2020 | $9,617 | $292,320 | $98,230 | $194,090 |
| 2019 | $9,617 | $292,320 | $98,230 | $194,090 |
| 2018 | $9,220 | $294,100 | $108,730 | $185,370 |
| 2017 | $8,997 | $294,100 | $108,730 | $185,370 |
| 2016 | $8,682 | $294,100 | $108,730 | $185,370 |
| 2015 | $8,470 | $294,100 | $108,730 | $185,370 |
| 2014 | $8,329 | $294,100 | $108,730 | $185,370 |
Source: Public Records
Map
Nearby Homes
- 51 Charing Cross
- 68 Scoville Rd
- 11 Hollister Dr
- 102 Country Club Rd
- 189 W Avon Rd
- 185 W Avon Rd
- 239 Old Farms Rd Unit 15A
- 239 Old Farms Rd Unit 18A
- 81 Bronson Rd
- 60 Hollister Dr
- 35 Burnham Rd
- 50 Northwoods Rd
- 26 Ridgewood Rd
- 13 Chatsworth Place
- 54 Pinewood Dr
- 68 Basswood Rd
- 16 Oak Bluff
- 7 Chestnut Dr
- 2 Muirfield Ln
- 39 Heritage Dr Unit 39