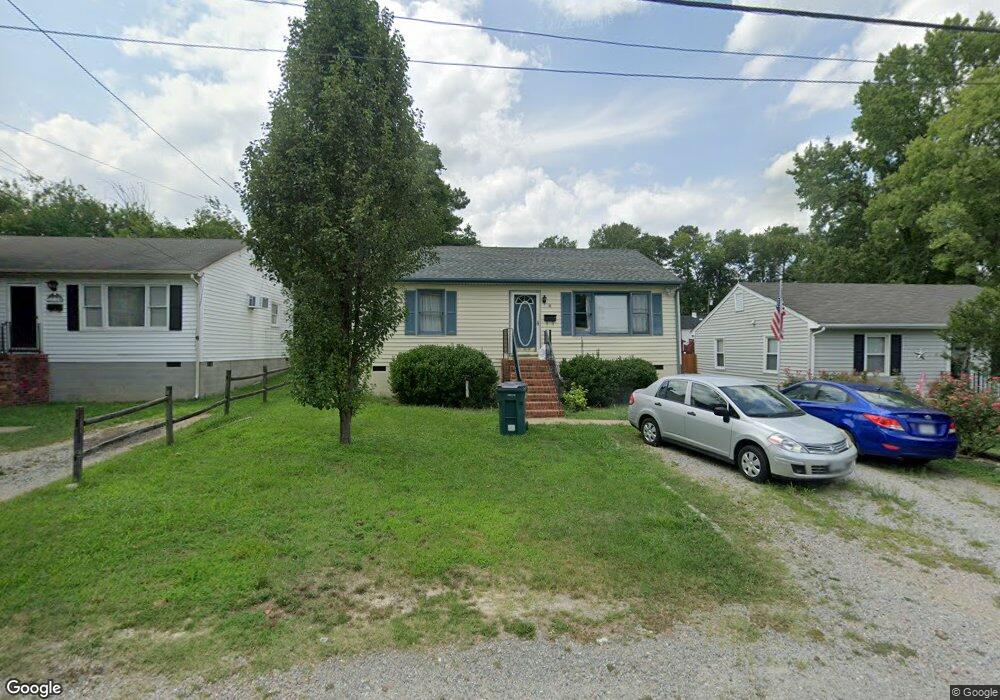
14 N Juniper Ave Henrico, VA 23075
Estimated Value: $232,263 - $250,000
3
Beds
1
Bath
980
Sq Ft
$247/Sq Ft
Est. Value
About This Home
This home is located at 14 N Juniper Ave, Henrico, VA 23075 and is currently estimated at $242,066, approximately $247 per square foot. 14 N Juniper Ave is a home located in Henrico County with nearby schools including Fair Oaks Elementary School, Elko Middle School, and Highland Springs High School.
Ownership History
Date
Name
Owned For
Owner Type
Purchase Details
Closed on
Mar 23, 2006
Sold by
Botts Ryan B
Bought by
Larocca Paula
Current Estimated Value
Home Financials for this Owner
Home Financials are based on the most recent Mortgage that was taken out on this home.
Original Mortgage
$95,950
Outstanding Balance
$54,579
Interest Rate
6.28%
Mortgage Type
New Conventional
Estimated Equity
$187,487
Purchase Details
Closed on
Aug 7, 2002
Sold by
Pair Kathelena M
Bought by
Botts Ryan M
Home Financials for this Owner
Home Financials are based on the most recent Mortgage that was taken out on this home.
Original Mortgage
$79,827
Interest Rate
6.58%
Mortgage Type
New Conventional
Purchase Details
Closed on
Jun 25, 2001
Sold by
Burke Cynthia D
Bought by
Pair Edward P and Pair Kathelena M
Purchase Details
Closed on
Mar 20, 2000
Sold by
Burke Gary W and Burke D
Bought by
Burke Cynthia D
Create a Home Valuation Report for This Property
The Home Valuation Report is an in-depth analysis detailing your home's value as well as a comparison with similar homes in the area
Home Values in the Area
Average Home Value in this Area
Purchase History
| Date | Buyer | Sale Price | Title Company |
|---|---|---|---|
| Larocca Paula | $119,950 | -- | |
| Botts Ryan M | $85,950 | -- | |
| Pair Edward P | $79,500 | -- | |
| Burke Cynthia D | -- | -- |
Source: Public Records
Mortgage History
| Date | Status | Borrower | Loan Amount |
|---|---|---|---|
| Open | Larocca Paula | $95,950 | |
| Previous Owner | Burke Cynthia D | $79,827 |
Source: Public Records
Tax History Compared to Growth
Tax History
| Year | Tax Paid | Tax Assessment Tax Assessment Total Assessment is a certain percentage of the fair market value that is determined by local assessors to be the total taxable value of land and additions on the property. | Land | Improvement |
|---|---|---|---|---|
| 2025 | -- | $194,700 | $32,500 | $162,200 |
| 2024 | $1,674 | $184,900 | $28,500 | $156,400 |
| 2023 | $1,590 | $184,900 | $28,500 | $156,400 |
| 2022 | $1,324 | $154,000 | $28,500 | $125,500 |
| 2021 | $1,207 | $123,400 | $20,500 | $102,900 |
| 2020 | $1,086 | $123,400 | $20,500 | $102,900 |
| 2019 | $1,001 | $113,700 | $18,000 | $95,700 |
| 2018 | $955 | $108,500 | $18,000 | $90,500 |
| 2017 | $863 | $98,100 | $18,000 | $80,100 |
| 2016 | $799 | $90,800 | $18,000 | $72,800 |
| 2015 | $780 | $88,600 | $22,000 | $66,600 |
| 2014 | $780 | $88,600 | $22,000 | $66,600 |
Source: Public Records
Map
Nearby Homes
- 11, 13, 17 N Holly Ave
- 111 N Mapleleaf Ave
- 120 N Grove Ave
- 16 N Elm Ave
- 4 N Elm Ave
- 202 N Grove Ave
- 206 N Oak Ave
- 111 S Grove Ave
- 227 N Linden Ave
- 238 N Kalmia Ave
- 233 N Mapleleaf Ave
- 104 N Beech Ave
- 518 E Washington St
- 15 N Battery St
- 505 Wales Dr
- 260 Sag Harbor Ct
- 312 Sag Harbor Place
- 4 W Jerald St
- 410 N Daisy Ave
- 402 N Ivy Ave
- 16 N Juniper Ave
- 12 N Juniper Ave
- 18 N Juniper Ave
- 10 N Juniper Ave
- 13 N Ivy Ave
- 8 N Juniper Ave
- 9 N Ivy Ave
- 15 N Juniper Ave
- 20 N Juniper Ave
- 17 N Juniper Ave
- 17 N Ivy Ave
- 13 N Juniper Ave
- 11 N Juniper Ave
- 19 N Juniper Ave
- 7 N Ivy Ave
- 19 N Ivy Ave
- 21 N Juniper Ave
- 9 N Juniper Ave
- 24 N Juniper Ave
- 23 N Juniper Ave