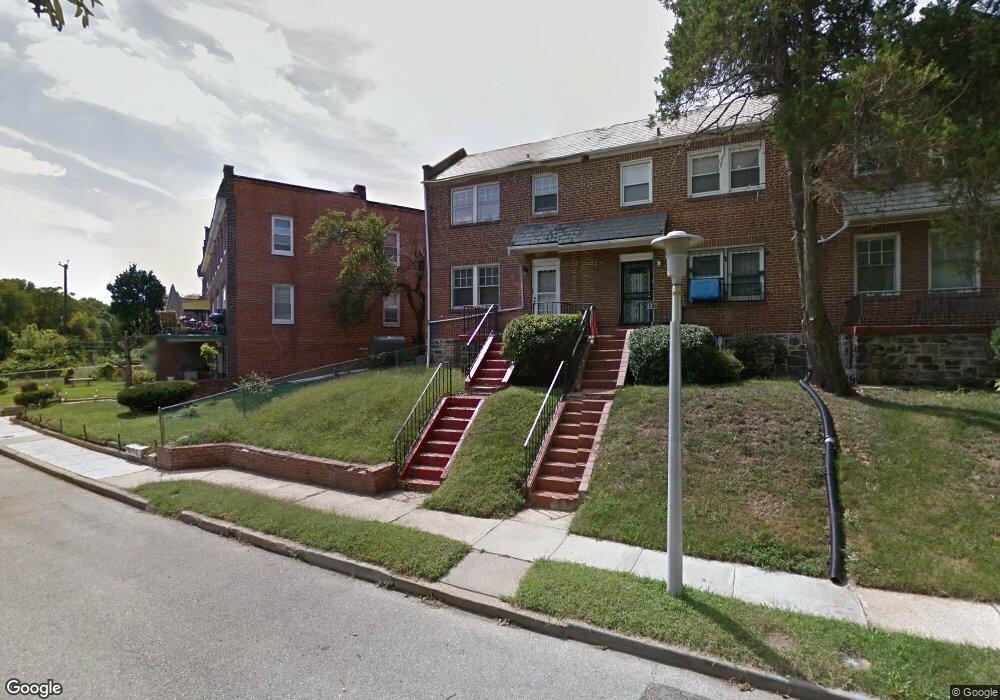
14 N Mount Olivet Ln Baltimore, MD 21229
Carroll-South Hilton NeighborhoodEstimated Value: $150,794 - $186,000
Studio
1
Bath
1,280
Sq Ft
$132/Sq Ft
Est. Value
About This Home
This home is located at 14 N Mount Olivet Ln, Baltimore, MD 21229 and is currently estimated at $168,397, approximately $131 per square foot. 14 N Mount Olivet Ln is a home located in Baltimore City with nearby schools including Mary E. Rodman Elementary School, Booker T. Washington Middle School, and Frederick Douglass High School.
Ownership History
Date
Name
Owned For
Owner Type
Purchase Details
Closed on
Oct 4, 2024
Sold by
Ground Rents Llc
Bought by
Kapital Express Holdings Llc
Current Estimated Value
Home Financials for this Owner
Home Financials are based on the most recent Mortgage that was taken out on this home.
Original Mortgage
$170,400
Interest Rate
6.87%
Mortgage Type
New Conventional
Purchase Details
Closed on
Sep 27, 2024
Sold by
Molock Sylvester and Sydor Debra L
Bought by
Kapital Express Holdings Llc
Home Financials for this Owner
Home Financials are based on the most recent Mortgage that was taken out on this home.
Original Mortgage
$170,400
Interest Rate
6.87%
Mortgage Type
New Conventional
Purchase Details
Closed on
Jun 30, 2003
Sold by
Molock Sylvester
Bought by
Molock Sylvester
Create a Home Valuation Report for This Property
The Home Valuation Report is an in-depth analysis detailing your home's value as well as a comparison with similar homes in the area
Home Values in the Area
Average Home Value in this Area
Purchase History
| Date | Buyer | Sale Price | Title Company |
|---|---|---|---|
| Kapital Express Holdings Llc | $1,500 | None Listed On Document | |
| Kapital Express Holdings Llc | $1,500 | None Listed On Document | |
| Kapital Express Holdings Llc | $77,500 | Dulaney Title | |
| Kapital Express Holdings Llc | $77,500 | Dulaney Title | |
| Molock Sylvester | -- | -- |
Source: Public Records
Mortgage History
| Date | Status | Borrower | Loan Amount |
|---|---|---|---|
| Previous Owner | Kapital Express Holdings Llc | $170,400 |
Source: Public Records
Tax History
| Year | Tax Paid | Tax Assessment Tax Assessment Total Assessment is a certain percentage of the fair market value that is determined by local assessors to be the total taxable value of land and additions on the property. | Land | Improvement |
|---|---|---|---|---|
| 2025 | $1,604 | $103,067 | -- | -- |
| 2024 | $1,604 | $89,933 | -- | -- |
| 2023 | $1,623 | $76,800 | $9,000 | $67,800 |
| 2022 | $1,625 | $76,800 | $9,000 | $67,800 |
| 2021 | $1,812 | $76,800 | $9,000 | $67,800 |
| 2020 | $1,639 | $77,700 | $9,000 | $68,700 |
| 2019 | $1,631 | $77,700 | $9,000 | $68,700 |
| 2018 | $1,662 | $77,700 | $9,000 | $68,700 |
| 2017 | $1,723 | $79,500 | $0 | $0 |
| 2016 | $1,583 | $79,500 | $0 | $0 |
| 2015 | $1,583 | $79,500 | $0 | $0 |
| 2014 | $1,583 | $92,300 | $0 | $0 |
Source: Public Records
Map
Nearby Homes
- 5 S Rosedale St
- 28 S Bernice Ave
- 12 S Ellamont St
- 8 N Ellamont St
- 22 N Ellamont St
- 48 N Ellamont St
- 3210 Massachusetts Ave
- 3215 Phelps Ln
- 234 S Mount Olivet Ln
- 3233 Phelps Ln
- 116 N Hilton St
- 118 N Hilton St
- 211 S Hilton St
- 156 S Hilton St
- 206 S Hilton St
- 3327 Elbert St
- 2 Benkert Ave
- 101 N Kossuth St
- 222 N Hilton St
- 12 N Kossuth St
- 12 N Mount Olivet Ln
- 18 N Mount Olivet Ln
- 10 N Mount Olivet Ln
- 20 N Mount Olivet Ln
- 8 N Mount Olivet Ln
- 6 N Mount Olivet Ln
- 22 N Mount Olivet Ln
- 11 N Rosedale St
- 13 N Rosedale St
- 4 N Mount Olivet Ln
- 9 N Rosedale St
- 7 N Rosedale St
- 24 N Mount Olivet Ln
- 3000 W Baltimore St
- 5 N Rosedale St
- 3 N Rosedale St
- 26 N Mount Olivet Ln
- 1 N Rosedale St
- 28 N Mount Olivet Ln
- 14 N Rosedale St
Your Personal Tour Guide
Ask me questions while you tour the home.