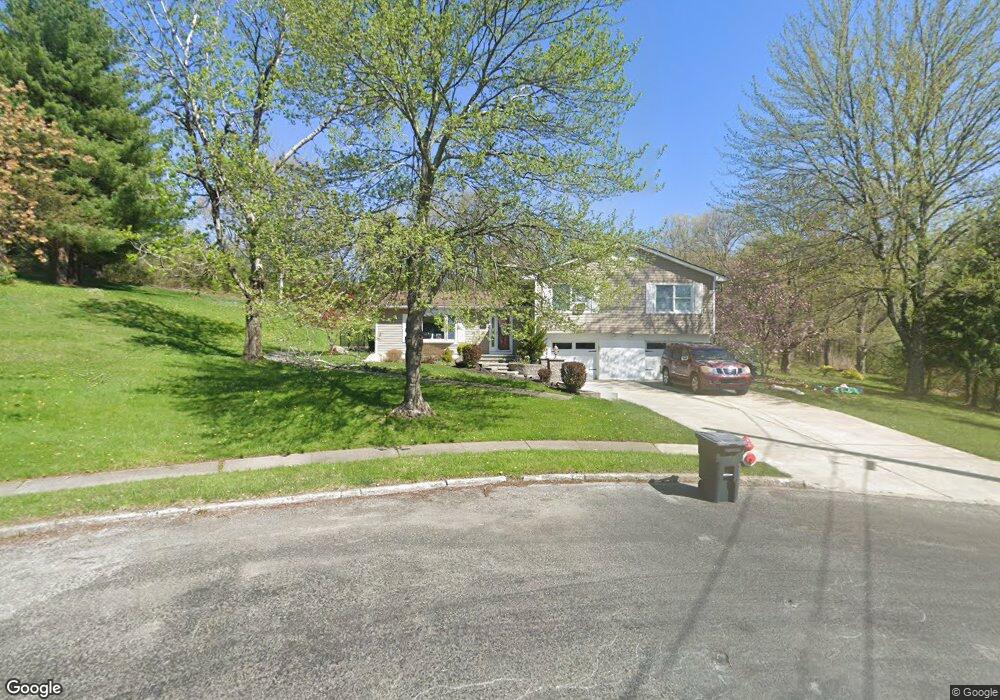
14 Neptune Ct Monroe, NY 10950
Estimated Value: $590,000 - $622,000
3
Beds
4
Baths
1,892
Sq Ft
$318/Sq Ft
Est. Value
About This Home
This home is located at 14 Neptune Ct, Monroe, NY 10950 and is currently estimated at $602,240, approximately $318 per square foot. 14 Neptune Ct is a home located in Orange County with nearby schools including Monroe-Woodbury Middle School, Monroe-Woodbury High School, and Bais Rochel School.
Ownership History
Date
Name
Owned For
Owner Type
Purchase Details
Closed on
Nov 14, 2019
Sold by
Sheldon Michael and Sheldon Anne
Bought by
Taylor Towanna M
Current Estimated Value
Purchase Details
Closed on
Oct 15, 2002
Sold by
Krebs Frederick H
Bought by
Hirt Lois D
Home Financials for this Owner
Home Financials are based on the most recent Mortgage that was taken out on this home.
Original Mortgage
$244,000
Interest Rate
6.55%
Purchase Details
Closed on
Aug 22, 2002
Sold by
Free Dorothy A
Bought by
Sheldon Michael and Sheldon Anne
Home Financials for this Owner
Home Financials are based on the most recent Mortgage that was taken out on this home.
Original Mortgage
$244,000
Interest Rate
6.55%
Purchase Details
Closed on
May 25, 2001
Sold by
Sinclair Niel and Burriss Kathryn
Bought by
Burriss Gary B and Burriss Kathryn Ann
Purchase Details
Closed on
May 17, 2001
Sold by
Free Clifford and Free Dorothy
Bought by
Free Dorothy A
Create a Home Valuation Report for This Property
The Home Valuation Report is an in-depth analysis detailing your home's value as well as a comparison with similar homes in the area
Home Values in the Area
Average Home Value in this Area
Purchase History
| Date | Buyer | Sale Price | Title Company |
|---|---|---|---|
| Taylor Towanna M | $420,000 | Stewart Title | |
| Hirt Lois D | -- | -- | |
| Sheldon Michael | $305,000 | -- | |
| Burriss Gary B | -- | -- | |
| Free Dorothy A | -- | -- |
Source: Public Records
Mortgage History
| Date | Status | Borrower | Loan Amount |
|---|---|---|---|
| Previous Owner | Sheldon Michael | $244,000 |
Source: Public Records
Tax History
| Year | Tax Paid | Tax Assessment Tax Assessment Total Assessment is a certain percentage of the fair market value that is determined by local assessors to be the total taxable value of land and additions on the property. | Land | Improvement |
|---|---|---|---|---|
| 2024 | $13,689 | $54,800 | $13,600 | $41,200 |
| 2023 | $13,689 | $54,800 | $13,600 | $41,200 |
| 2022 | $13,246 | $54,800 | $13,600 | $41,200 |
| 2021 | $13,122 | $54,800 | $13,600 | $41,200 |
| 2020 | $11,406 | $54,800 | $13,600 | $41,200 |
| 2019 | $10,152 | $54,100 | $13,600 | $40,500 |
| 2018 | $10,152 | $54,100 | $13,600 | $40,500 |
| 2017 | $10,369 | $54,100 | $13,600 | $40,500 |
| 2016 | $10,434 | $54,100 | $13,600 | $40,500 |
| 2015 | -- | $58,000 | $13,600 | $44,400 |
| 2014 | -- | $58,000 | $13,600 | $44,400 |
Source: Public Records
Map
Nearby Homes
- 6 Neptune Ct
- 132 Neptune Dr
- 15 Aquarius St
- 8 Laura Rd
- 651 Lakes Rd
- 556 Lakes Rd
- 380 Rye Hill Rd
- 6 Alley Rd
- 10 Karen Dr
- 0 St Georges Ave Unit KEY875311
- 133 W Mombasha Rd
- 26 St Georges Ave
- 30 Harding Way
- 5 Berkley Terrace
- 4 Maple Ln
- 19 Hilltop Place
- 3 Tulip Ln
- 71 Walton Terrace
- 5 Deangelis Dr
- 12 Juniper Ln
- 11 Neptune Ct Unit B1
- 12 Neptune Ct
- 7 Neptune Ct
- 8 Neptune Ct
- 377 W Mombasha Rd
- 5 Neptune Ct
- 14 Mercury Ave
- 102 Neptune Dr
- 104 Mercury Ct
- 12 Mercury Ave
- 118 Neptune Dr
- 110 Mercury Ct
- 11 Mercury Ave
- 4 Mercury Ave
- 5 Mercury Ave
- 107 Mercury Ct
- 112 Mercury Ct
- 123 Neptune Dr
- 109 Mercury Ct
- 125 Neptune Dr
Your Personal Tour Guide
Ask me questions while you tour the home.