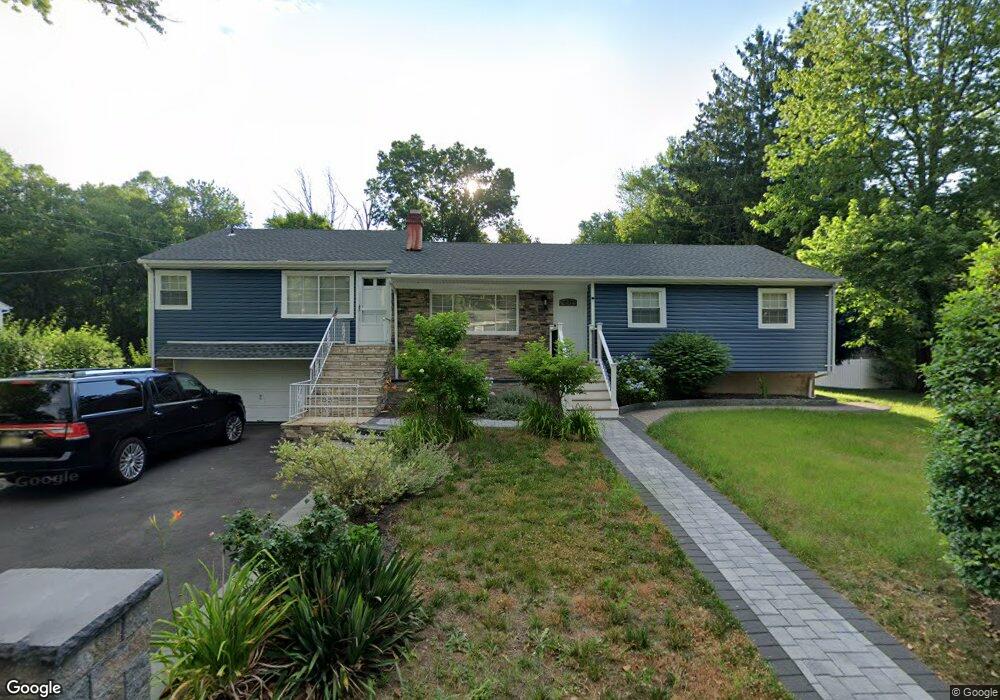
14 North St Old Bridge, NJ 08857
Estimated Value: $580,000 - $680,077
2
Beds
4
Baths
1,774
Sq Ft
$352/Sq Ft
Est. Value
About This Home
This home is located at 14 North St, Old Bridge, NJ 08857 and is currently estimated at $624,019, approximately $351 per square foot. 14 North St is a home located in Middlesex County with nearby schools including Old Bridge High School, St. Thomas the Apostle School, and Immaculate Conception School.
Ownership History
Date
Name
Owned For
Owner Type
Purchase Details
Closed on
Sep 25, 2007
Sold by
Burke James R and Burke Cynthia L
Bought by
Munoz Jesus
Current Estimated Value
Home Financials for this Owner
Home Financials are based on the most recent Mortgage that was taken out on this home.
Original Mortgage
$40,000
Outstanding Balance
$25,544
Interest Rate
6.65%
Mortgage Type
Credit Line Revolving
Estimated Equity
$598,475
Purchase Details
Closed on
Jul 17, 2000
Sold by
First Fidelity Bank
Bought by
Burke James and Burke Cynthia
Create a Home Valuation Report for This Property
The Home Valuation Report is an in-depth analysis detailing your home's value as well as a comparison with similar homes in the area
Home Values in the Area
Average Home Value in this Area
Purchase History
| Date | Buyer | Sale Price | Title Company |
|---|---|---|---|
| Munoz Jesus | $400,000 | First American Title Ins Co | |
| Burke James | $130,000 | -- |
Source: Public Records
Mortgage History
| Date | Status | Borrower | Loan Amount |
|---|---|---|---|
| Open | Munoz Jesus | $40,000 | |
| Open | Munoz Jesus | $320,000 |
Source: Public Records
Tax History
| Year | Tax Paid | Tax Assessment Tax Assessment Total Assessment is a certain percentage of the fair market value that is determined by local assessors to be the total taxable value of land and additions on the property. | Land | Improvement |
|---|---|---|---|---|
| 2025 | $9,351 | $165,600 | $56,000 | $109,600 |
| 2024 | $8,971 | $165,600 | $56,000 | $109,600 |
Source: Public Records
Map
Nearby Homes
- 34 Brookside Ave
- 14 Brookside Ave
- 1283 Englishtown Rd
- 1299 Englishtown Rd
- 1210 Englishtown Rd
- 45 Piersoll Rd
- 24 Kensington Ave
- 30 Arvin Rd
- 98 Madison Ave
- 21 Fourth St
- 205 Main St
- 289 Main St Unit 6E
- 289 Main St Unit 3C
- 289 Main St Unit 10F
- 931 Englishtown Rd
- 12 Brookside Rd
- 54 Red Bank Rd
- 321 Main St
- 21 Pine St
- 35 Birch St
Your Personal Tour Guide
Ask me questions while you tour the home.