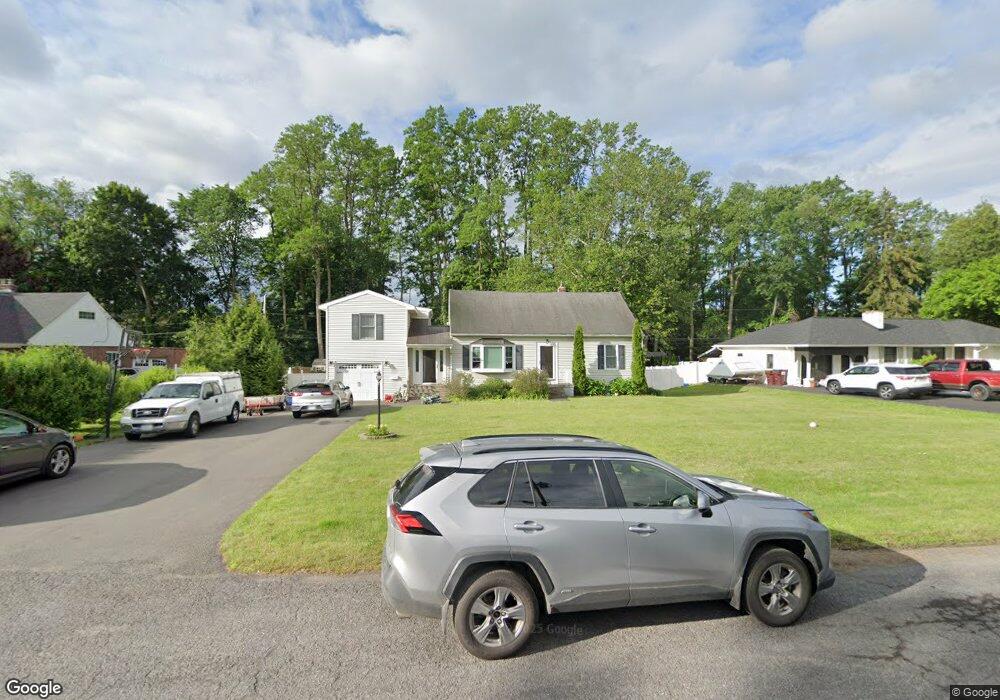
14 Noxon Ct Albany, NY 12211
Estimated Value: $351,000 - $451,118
4
Beds
3
Baths
1,806
Sq Ft
$230/Sq Ft
Est. Value
About This Home
This home is located at 14 Noxon Ct, Albany, NY 12211 and is currently estimated at $415,780, approximately $230 per square foot. 14 Noxon Ct is a home located in Albany County with nearby schools including Loudonville Elementary School, Shaker Junior High School, and Shaker High School.
Ownership History
Date
Name
Owned For
Owner Type
Purchase Details
Closed on
Apr 29, 2008
Sold by
Fredenburgh Jeffrey G
Bought by
Arze Thomas G
Current Estimated Value
Home Financials for this Owner
Home Financials are based on the most recent Mortgage that was taken out on this home.
Original Mortgage
$208,000
Outstanding Balance
$43,936
Interest Rate
5.99%
Mortgage Type
New Conventional
Estimated Equity
$371,844
Purchase Details
Closed on
Apr 16, 2008
Sold by
Fredenburgh Jeffrey G and Custer Linda L
Bought by
Arze Thomas G and Arze Amanda M
Home Financials for this Owner
Home Financials are based on the most recent Mortgage that was taken out on this home.
Original Mortgage
$208,000
Outstanding Balance
$43,936
Interest Rate
5.99%
Mortgage Type
New Conventional
Estimated Equity
$371,844
Purchase Details
Closed on
Jan 28, 2005
Sold by
Custer Linda
Bought by
Fredenburgh Jeffrey
Purchase Details
Closed on
May 19, 2003
Sold by
Fredenburgh Walter F
Bought by
Custer Linda L
Create a Home Valuation Report for This Property
The Home Valuation Report is an in-depth analysis detailing your home's value as well as a comparison with similar homes in the area
Home Values in the Area
Average Home Value in this Area
Purchase History
| Date | Buyer | Sale Price | Title Company |
|---|---|---|---|
| Arze Thomas G | $220,000 | Thomas Spain | |
| Arze Thomas G | $220,000 | None Available | |
| Fredenburgh Jeffrey | -- | -- | |
| Custer Linda L | -- | -- |
Source: Public Records
Mortgage History
| Date | Status | Borrower | Loan Amount |
|---|---|---|---|
| Open | Arze Thomas G | $208,000 | |
| Closed | Arze Thomas G | $208,000 |
Source: Public Records
Tax History Compared to Growth
Tax History
| Year | Tax Paid | Tax Assessment Tax Assessment Total Assessment is a certain percentage of the fair market value that is determined by local assessors to be the total taxable value of land and additions on the property. | Land | Improvement |
|---|---|---|---|---|
| 2024 | $6,333 | $150,000 | $37,500 | $112,500 |
| 2023 | $6,184 | $150,000 | $37,500 | $112,500 |
| 2022 | $6,056 | $150,000 | $37,500 | $112,500 |
| 2021 | $6,029 | $150,000 | $37,500 | $112,500 |
| 2020 | $5,426 | $150,000 | $37,500 | $112,500 |
| 2019 | $3,044 | $150,000 | $37,500 | $112,500 |
| 2018 | $5,322 | $150,000 | $37,500 | $112,500 |
| 2017 | $0 | $150,000 | $37,500 | $112,500 |
| 2016 | $5,289 | $150,000 | $37,500 | $112,500 |
| 2015 | -- | $150,000 | $37,500 | $112,500 |
| 2014 | -- | $150,000 | $37,500 | $112,500 |
Source: Public Records
Map
Nearby Homes
- 9 Laurel Dr
- 3 Chestnut Hill Rd N
- 10 Willo Ln
- 30 Princess Ln
- 10 Kasper Dr
- 417 Albany Shaker Rd
- 4 Wedgewood Dr
- 12 Delucia Terrace
- 6 Wedgewood Dr
- 44 Turner Ln
- 522 Loudon Rd
- 23 Steeple View Dr
- 42 Pheasant Ridge Dr
- 479 Albany Shaker Rd
- 15 Tower Heights
- 18 Sage Hill Ln
- 12 Lynnwood Dr
- 22 Danielwood Dr
- 495 Albany Shaker Rd
- 18 Anthony Ln
- 16 Noxon Ct
- 12 Noxon Ct
- 18 Noxon Ct
- 10 Noxon Ct
- 21 Cherry Tree Rd
- 23 Cherry Tree Rd
- 336 Osborne Rd
- 334 Osborne Rd
- 17 Cherry Tree Rd
- 25 Cherry Tree La
- 332 Osborne Rd
- 338 Osborne Rd
- 25 Cherry Tree Rd
- 8 Noxon Ct
- 20 Noxon Ct
- 15 Cherry Tree Rd
- 330 Osborne Rd
- 27 Cherry Tree Rd
- 340 Osborne Rd
- 328 Osborne Rd