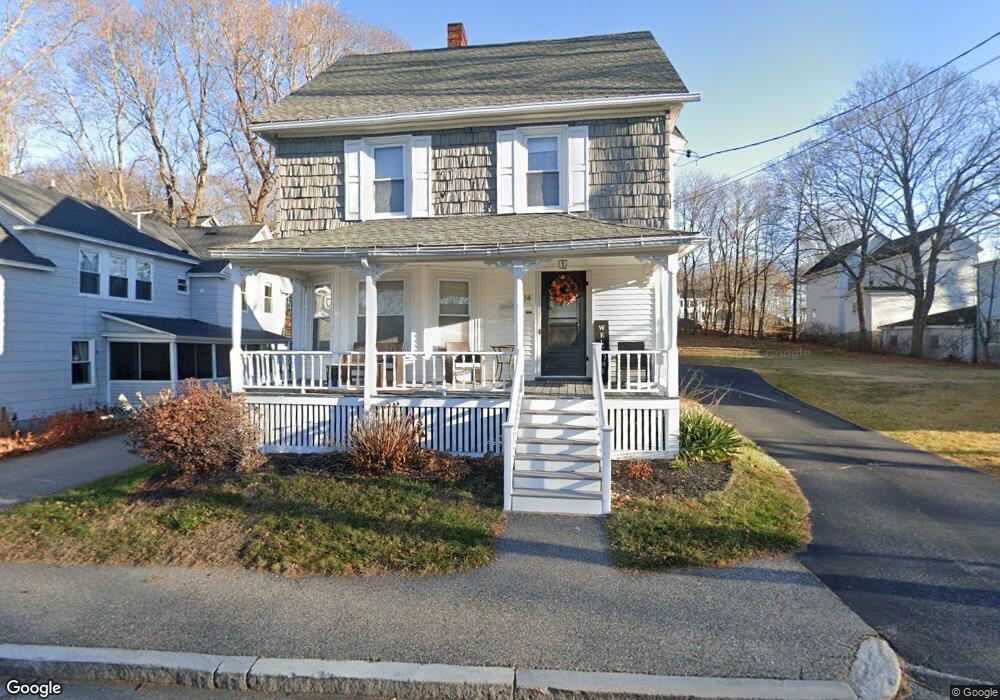
14 Orchard St Biddeford, ME 04005
Estimated Value: $426,000 - $458,000
3
Beds
2
Baths
1,427
Sq Ft
$306/Sq Ft
Est. Value
About This Home
This home is located at 14 Orchard St, Biddeford, ME 04005 and is currently estimated at $436,982, approximately $306 per square foot. 14 Orchard St is a home located in York County with nearby schools including John F Kennedy Memorial School, Biddeford Primary School, and Biddeford Intermediate School.
Ownership History
Date
Name
Owned For
Owner Type
Purchase Details
Closed on
Aug 2, 2010
Sold by
Pepin Louise D and Pepin Albert A
Bought by
Hodge Hallie A
Current Estimated Value
Home Financials for this Owner
Home Financials are based on the most recent Mortgage that was taken out on this home.
Original Mortgage
$148,006
Outstanding Balance
$98,880
Interest Rate
4.75%
Mortgage Type
FHA
Estimated Equity
$338,102
Create a Home Valuation Report for This Property
The Home Valuation Report is an in-depth analysis detailing your home's value as well as a comparison with similar homes in the area
Home Values in the Area
Average Home Value in this Area
Purchase History
| Date | Buyer | Sale Price | Title Company |
|---|---|---|---|
| Hodge Hallie A | -- | -- |
Source: Public Records
Mortgage History
| Date | Status | Borrower | Loan Amount |
|---|---|---|---|
| Open | Hodge Hallie A | $148,006 |
Source: Public Records
Tax History Compared to Growth
Tax History
| Year | Tax Paid | Tax Assessment Tax Assessment Total Assessment is a certain percentage of the fair market value that is determined by local assessors to be the total taxable value of land and additions on the property. | Land | Improvement |
|---|---|---|---|---|
| 2024 | $3,868 | $272,000 | $159,700 | $112,300 |
| 2023 | $3,532 | $269,200 | $156,900 | $112,300 |
| 2022 | $3,553 | $216,500 | $88,200 | $128,300 |
| 2021 | $2,864 | $182,100 | $74,700 | $107,400 |
| 2020 | $0 | $166,100 | $67,900 | $98,200 |
| 2019 | $5,087 | $166,100 | $67,900 | $98,200 |
| 2018 | $3,513 | $166,100 | $67,900 | $98,200 |
| 2017 | $0 | $162,600 | $67,900 | $94,700 |
| 2016 | $3,229 | $162,600 | $67,900 | $94,700 |
| 2015 | $2,928 | $160,400 | $67,900 | $92,500 |
| 2014 | $2,856 | $160,400 | $67,900 | $92,500 |
| 2013 | -- | $165,500 | $61,800 | $103,700 |
Source: Public Records
Map
Nearby Homes