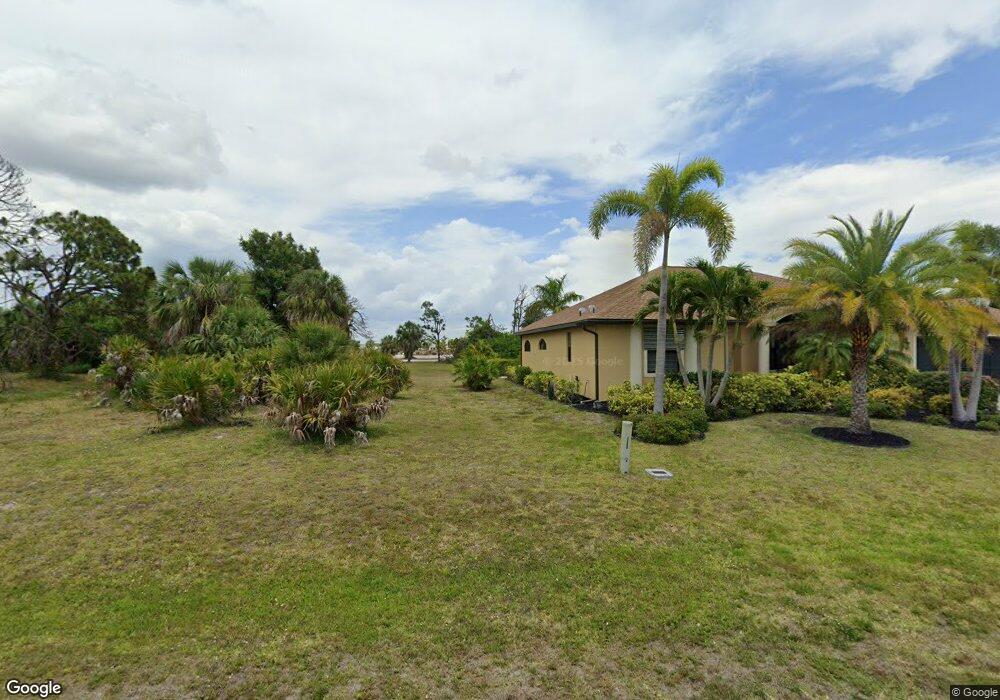
14 Pinehurst Ct Rotonda West, FL 33947
Estimated Value: $380,727 - $482,000
Studio
2
Baths
1,906
Sq Ft
$229/Sq Ft
Est. Value
About This Home
This home is located at 14 Pinehurst Ct, Rotonda West, FL 33947 and is currently estimated at $437,182, approximately $229 per square foot. 14 Pinehurst Ct is a home located in Charlotte County with nearby schools including Vineland Elementary School, L.A. Ainger Middle School, and Lemon Bay High School.
Ownership History
Date
Name
Owned For
Owner Type
Purchase Details
Closed on
Dec 18, 2019
Sold by
Lofrese Anthony P and Lofrese Evelyn B
Bought by
Lofrese Anthony P and Lofrese Evelyn B
Current Estimated Value
Purchase Details
Closed on
Jan 31, 2014
Sold by
Koch Larry F and Koch Lorraine
Bought by
Lofrese Anthony P and Lofrese Evelyn B
Purchase Details
Closed on
Feb 13, 2007
Sold by
Wehrenberg Peter S and Wehrenberg Adele M
Bought by
Koch Larry F and Stoddard Lorraine
Home Financials for this Owner
Home Financials are based on the most recent Mortgage that was taken out on this home.
Original Mortgage
$200,000
Interest Rate
6.08%
Mortgage Type
Purchase Money Mortgage
Purchase Details
Closed on
Jul 18, 2002
Sold by
Wehrenberg Peter S and Wehrenberg Adele M
Bought by
Wehrenberg Peter S
Purchase Details
Closed on
Feb 7, 1995
Sold by
Hogue Donald R and Hogue Julia E
Bought by
Wehrenberg Peter S and Wehrenberg Adele M
Create a Home Valuation Report for This Property
The Home Valuation Report is an in-depth analysis detailing your home's value as well as a comparison with similar homes in the area
Home Values in the Area
Average Home Value in this Area
Purchase History
| Date | Buyer | Sale Price | Title Company |
|---|---|---|---|
| Lofrese Anthony P | -- | Attorney | |
| Lofrese Anthony P | $194,000 | Msc Title Inc | |
| Koch Larry F | $250,000 | Dba Premier Title Of Florida | |
| Wehrenberg Peter S | -- | -- | |
| Wehrenberg Peter S | $119,900 | -- |
Source: Public Records
Mortgage History
| Date | Status | Borrower | Loan Amount |
|---|---|---|---|
| Previous Owner | Koch Larry F | $200,000 |
Source: Public Records
Tax History
| Year | Tax Paid | Tax Assessment Tax Assessment Total Assessment is a certain percentage of the fair market value that is determined by local assessors to be the total taxable value of land and additions on the property. | Land | Improvement |
|---|---|---|---|---|
| 2025 | $4,330 | $261,639 | -- | -- |
| 2023 | $4,290 | $245,450 | $0 | $0 |
| 2022 | $4,182 | $239,669 | $0 | $0 |
| 2021 | $4,172 | $232,688 | $0 | $0 |
| 2020 | $3,920 | $229,475 | $19,550 | $209,925 |
| 2019 | $3,713 | $229,342 | $22,100 | $207,242 |
| 2018 | $4,110 | $224,384 | $22,950 | $201,434 |
| 2017 | $4,012 | $224,745 | $22,610 | $202,135 |
| 2016 | $3,654 | $190,026 | $0 | $0 |
| 2015 | $3,548 | $182,291 | $0 | $0 |
| 2014 | $3,216 | $161,904 | $0 | $0 |
Source: Public Records
Map
Nearby Homes
- 36 Pinehurst Ct
- 11 Pinehurst Ct
- 25 Fairway Rd
- 230 Fairway Rd
- 17 Fairway Rd
- 204 Fairway Rd
- 212 Fairway Rd
- 27 Mariner Ln
- 437 Rotonda Cir
- 443 Rotonda Cir
- 259 Mark Twain Ln
- 192 Mariner Ln
- 79 Mariner Ln
- 279 Mark Twain Ln
- 63 Clubhouse Rd
- 66 Fairway Rd
- 254 Mark Twain Ln
- 168 Mark Twain Ln
- 55 Clubhouse Rd
- 20 Clubhouse Ct
- 16 Pinehurst Ct
- 12 Pinehurst Ct
- 20 Pinehurst Ct
- 17 Pinehurst Ct
- 15 Pinehurst Ct
- 13 Pinehurst Ct
- 23 Pinehurst Ct
- 8 Pinehurst Ct
- 9 Pinehurst Ct
- 6 Pinehurst Ct
- 26 Pinehurst Ct
- 7 Pinehurst Ct
- 27 Pinehurst Ct
- 28 Pinehurst Ct
- 29 Pinehurst Ct
- 5 Pinehurst Ct
- 30 Pinehurst Ct
- 20 Fairway Rd
- 18 Fairway Rd
- 22 & 24 Fairway Rd
Your Personal Tour Guide
Ask me questions while you tour the home.