14 Pretto Way Unit 1 Plymouth, MA 02360
Estimated Value: $571,402 - $609,000
3
Beds
2
Baths
1,610
Sq Ft
$369/Sq Ft
Est. Value
About This Home
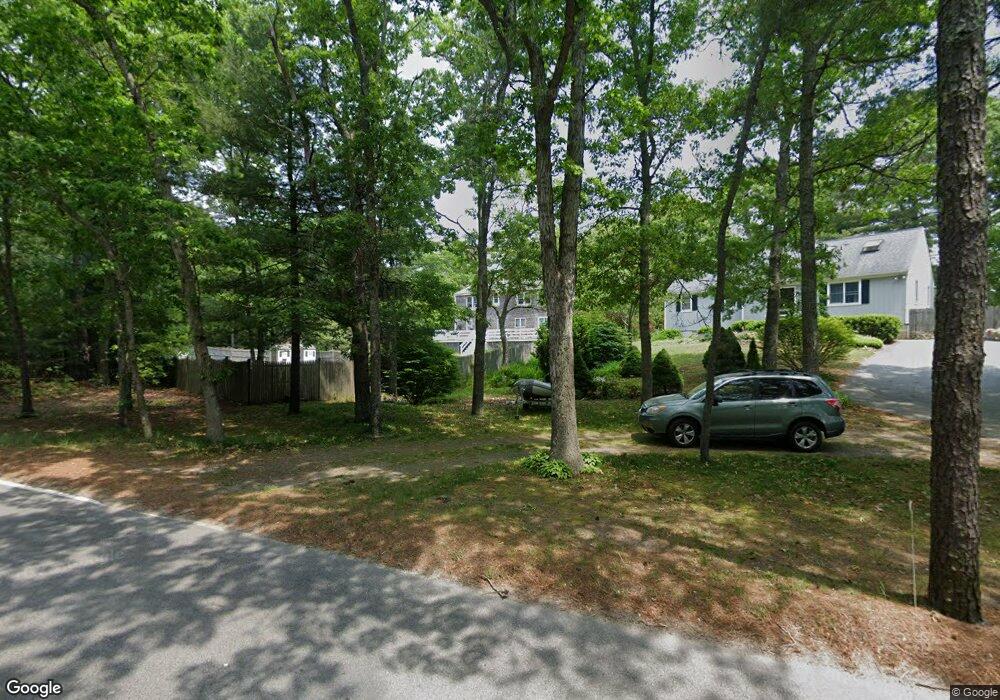
This home is located at 14 Pretto Way Unit 1, Plymouth, MA 02360 and is currently estimated at $593,351, approximately $368 per square foot. 14 Pretto Way Unit 1 is a home located in Plymouth County with nearby schools including South Elementary School, Plymouth South Middle School, and Plymouth South High School.
Ownership History
Date
Name
Owned For
Owner Type
Purchase Details
Closed on
Jul 11, 2003
Sold by
Heidke David
Bought by
Batchelder Diane J
Current Estimated Value
Purchase Details
Closed on
Feb 25, 1994
Sold by
Finn Stephen J and Finn Debra M
Bought by
Heidke David R and Heidke Kim
Create a Home Valuation Report for This Property
The Home Valuation Report is an in-depth analysis detailing your home's value as well as a comparison with similar homes in the area
Home Values in the Area
Average Home Value in this Area
Purchase History
| Date | Buyer | Sale Price | Title Company |
|---|---|---|---|
| Batchelder Diane J | $275,000 | -- | |
| Heidke David R | $125,000 | -- | |
| Heidke David R | $125,000 | -- |
Source: Public Records
Mortgage History
| Date | Status | Borrower | Loan Amount |
|---|---|---|---|
| Previous Owner | Heidke David R | $7,000 | |
| Previous Owner | Heidke David R | $117,500 |
Source: Public Records
Tax History Compared to Growth
Tax History
| Year | Tax Paid | Tax Assessment Tax Assessment Total Assessment is a certain percentage of the fair market value that is determined by local assessors to be the total taxable value of land and additions on the property. | Land | Improvement |
|---|---|---|---|---|
| 2025 | $5,737 | $452,100 | $194,800 | $257,300 |
| 2024 | $5,654 | $439,300 | $190,800 | $248,500 |
| 2023 | $5,443 | $397,000 | $166,800 | $230,200 |
| 2022 | $5,101 | $330,600 | $151,600 | $179,000 |
| 2021 | $4,906 | $303,600 | $151,600 | $152,000 |
| 2020 | $4,859 | $297,200 | $147,600 | $149,600 |
| 2019 | $4,674 | $282,600 | $131,600 | $151,000 |
| 2018 | $4,479 | $272,100 | $121,600 | $150,500 |
| 2017 | $4,249 | $256,300 | $121,600 | $134,700 |
| 2016 | $4,027 | $247,500 | $111,600 | $135,900 |
| 2015 | $3,817 | $245,600 | $111,600 | $134,000 |
| 2014 | $3,657 | $241,700 | $111,600 | $130,100 |
Source: Public Records
Map
Nearby Homes