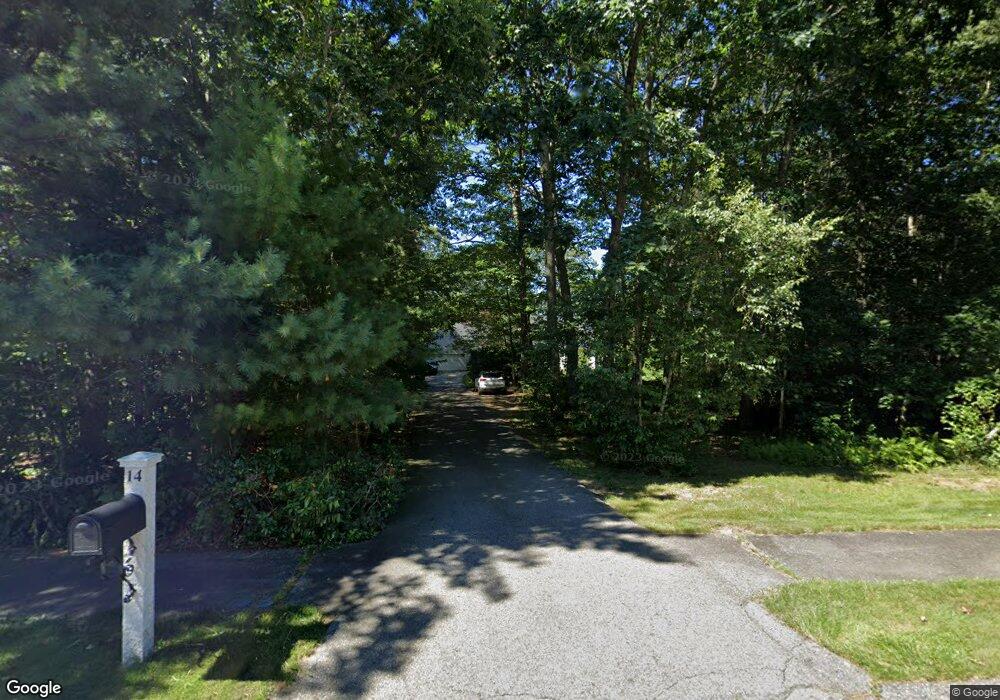
14 Red Oak St Paxton, MA 01612
Estimated Value: $618,000 - $682,000
3
Beds
3
Baths
2,138
Sq Ft
$302/Sq Ft
Est. Value
About This Home
This home is located at 14 Red Oak St, Paxton, MA 01612 and is currently estimated at $646,672, approximately $302 per square foot. 14 Red Oak St is a home located in Worcester County with nearby schools including Wachusett Regional High School.
Ownership History
Date
Name
Owned For
Owner Type
Purchase Details
Closed on
May 18, 2018
Sold by
Gaffney Joseph P and Gaffney Pauline M
Bought by
Gaffney Lt
Current Estimated Value
Purchase Details
Closed on
Aug 21, 1991
Sold by
Paxton Pond Rt
Bought by
Gaffney Joseph P and Pauline Maillet
Home Financials for this Owner
Home Financials are based on the most recent Mortgage that was taken out on this home.
Original Mortgage
$120,000
Interest Rate
9.55%
Mortgage Type
Purchase Money Mortgage
Create a Home Valuation Report for This Property
The Home Valuation Report is an in-depth analysis detailing your home's value as well as a comparison with similar homes in the area
Home Values in the Area
Average Home Value in this Area
Purchase History
| Date | Buyer | Sale Price | Title Company |
|---|---|---|---|
| Gaffney Lt | -- | -- | |
| Gaffney Joseph P | $55,000 | -- |
Source: Public Records
Mortgage History
| Date | Status | Borrower | Loan Amount |
|---|---|---|---|
| Previous Owner | Gaffney Joseph P | $101,000 | |
| Previous Owner | Gaffney Joseph P | $122,000 | |
| Previous Owner | Gaffney Joseph P | $120,000 |
Source: Public Records
Tax History
| Year | Tax Paid | Tax Assessment Tax Assessment Total Assessment is a certain percentage of the fair market value that is determined by local assessors to be the total taxable value of land and additions on the property. | Land | Improvement |
|---|---|---|---|---|
| 2025 | $8,092 | $549,000 | $121,100 | $427,900 |
| 2024 | $7,667 | $477,100 | $121,100 | $356,000 |
| 2023 | $7,760 | $441,400 | $110,400 | $331,000 |
| 2022 | $7,277 | $383,400 | $110,400 | $273,000 |
| 2021 | $7,345 | $372,300 | $100,900 | $271,400 |
| 2020 | $7,172 | $363,500 | $92,100 | $271,400 |
| 2019 | $7,014 | $355,300 | $83,900 | $271,400 |
| 2018 | $6,550 | $320,600 | $77,000 | $243,600 |
| 2017 | $6,468 | $317,200 | $73,300 | $243,900 |
| 2016 | $6,233 | $302,700 | $73,300 | $229,400 |
| 2015 | $5,823 | $280,100 | $73,300 | $206,800 |
| 2014 | $5,646 | $275,300 | $73,500 | $201,800 |
Source: Public Records
Map
Nearby Homes
- 620 Pleasant St
- 12 Point Eastalee Dr
- 9 Forestdale Rd
- 99 Lakeshore Dr
- 7 Cedar Rd
- 309 Pleasant St
- 11 Walbridge Rd
- 4 Crestwood Rd
- 2 Crestwood Rd
- 37 Thompson Pond Rd
- 2 Nottingham Cir
- 78 Asnebumskit Rd
- 72 Holden Rd
- 58 Streeter Rd
- 196 N Spencer Rd
- 1576 Main St
- LOT 8 Pierre Cir
- 150 Paxton St
- 45 Sussex Ln
- 1A S Main St
Your Personal Tour Guide
Ask me questions while you tour the home.