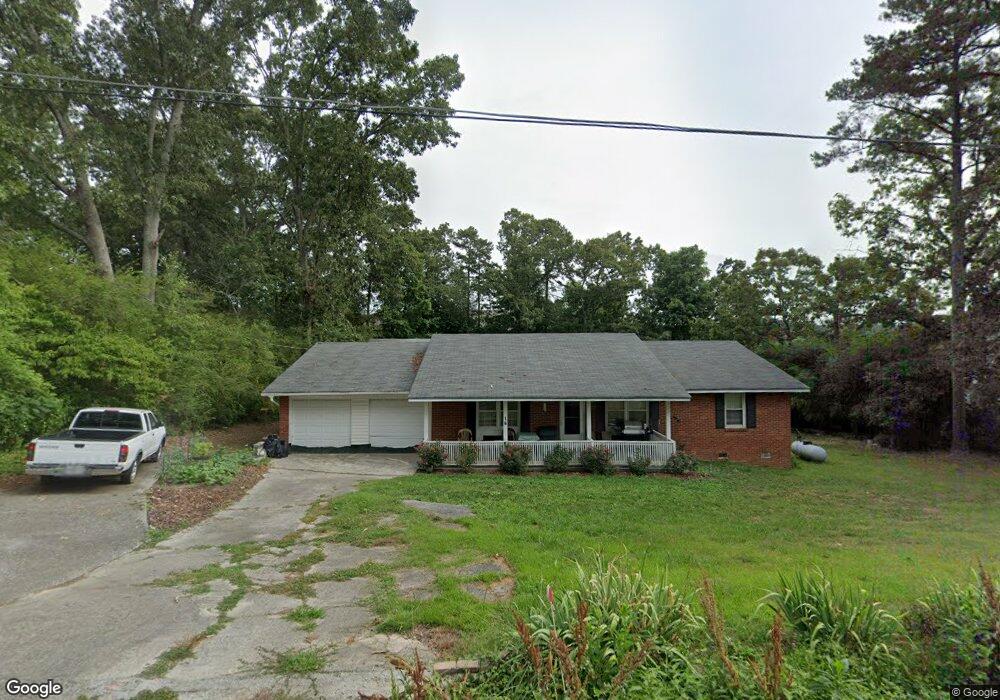
14 Rock Fence Cir SE Cartersville, GA 30121
Estimated Value: $226,000 - $325,000
3
Beds
2
Baths
1,409
Sq Ft
$198/Sq Ft
Est. Value
About This Home
This home is located at 14 Rock Fence Cir SE, Cartersville, GA 30121 and is currently estimated at $278,816, approximately $197 per square foot. 14 Rock Fence Cir SE is a home located in Bartow County with nearby schools including Cloverleaf Elementary School, Red Top Middle School, and Woodland High School.
Ownership History
Date
Name
Owned For
Owner Type
Purchase Details
Closed on
May 6, 2019
Sold by
Miller Bertie Sue
Bought by
Miller Bertie Sue and Miller Carlas Oneal
Current Estimated Value
Purchase Details
Closed on
Dec 13, 2016
Sold by
Oneal Carlas
Bought by
Miller Bertie Sue
Purchase Details
Closed on
Mar 20, 2015
Sold by
Miller Bertie Sue
Bought by
Miller Carlas Oneal
Purchase Details
Closed on
Jun 21, 2011
Sold by
Secretary Of Housing
Bought by
Miller Bertie Sue
Purchase Details
Closed on
Aug 3, 2010
Sold by
Citimortgage Inc
Bought by
Sec Dept Of Housing
Purchase Details
Closed on
Mar 14, 2008
Sold by
James Jasper A
Bought by
Howren Brandy
Home Financials for this Owner
Home Financials are based on the most recent Mortgage that was taken out on this home.
Original Mortgage
$137,344
Interest Rate
5.68%
Mortgage Type
FHA
Create a Home Valuation Report for This Property
The Home Valuation Report is an in-depth analysis detailing your home's value as well as a comparison with similar homes in the area
Home Values in the Area
Average Home Value in this Area
Purchase History
| Date | Buyer | Sale Price | Title Company |
|---|---|---|---|
| Miller Bertie Sue | -- | -- | |
| Miller Bertie Sue | $70,000 | -- | |
| Miller Carlas Oneal | $25,000 | -- | |
| Miller Bertie Sue | $38,100 | -- | |
| Miller Bertie Sue | $38,100 | -- | |
| Sec Dept Of Housing | $153,904 | -- | |
| Citimortgage Inc | $153,904 | -- | |
| Howren Brandy | $139,500 | -- |
Source: Public Records
Mortgage History
| Date | Status | Borrower | Loan Amount |
|---|---|---|---|
| Previous Owner | Howren Brandy | $137,344 |
Source: Public Records
Tax History Compared to Growth
Tax History
| Year | Tax Paid | Tax Assessment Tax Assessment Total Assessment is a certain percentage of the fair market value that is determined by local assessors to be the total taxable value of land and additions on the property. | Land | Improvement |
|---|---|---|---|---|
| 2024 | $425 | $76,931 | $16,000 | $60,931 |
| 2023 | $460 | $71,083 | $16,000 | $55,083 |
| 2022 | $899 | $65,983 | $16,000 | $49,983 |
| 2021 | $593 | $52,593 | $16,000 | $36,593 |
| 2020 | $545 | $48,593 | $12,000 | $36,593 |
| 2019 | $443 | $44,586 | $10,000 | $34,586 |
| 2018 | $373 | $42,075 | $8,000 | $34,075 |
| 2017 | $235 | $31,120 | $4,800 | $26,320 |
| 2016 | $737 | $31,120 | $4,800 | $26,320 |
| 2015 | $879 | $31,120 | $4,800 | $26,320 |
| 2014 | -- | $29,760 | $6,000 | $23,760 |
| 2013 | -- | $28,680 | $3,800 | $24,880 |
Source: Public Records
Map
Nearby Homes
- 90 Smiley Ingram Rd SE
- 17 W Ridge Dr SE
- 00 Lewis Rd
- 40 Azalea Dr SE
- 12 Leslie Cove SE
- 351 State Route 20 Spur SE
- 5700 Highway 20 SE
- 37 Waterstone Dr SE
- 17 Pinoak Trail
- 36 Weather View Trail SE
- 27 Berryhill Place SE
- 10 Berryhill Place
- 10 Weather View Trail SE
- 658 Center Rd
- 27 Autumn Canyon Path SE
- 40 Luther Knight Rd SE
- 84 Cline-Smith Rd
- 16 Canyon Trail SE
- 20 Rock Fence Cir SE
- 30 Rock Fence Cir SE
- 21 Rock Fence Cir SE
- 33 Smiley Ingram Rd SE
- 31 Rock Fence Cir SE
- 122 Rock Fence Cir SE
- 122 Rock Fence Cir SE
- 122 Rock Fence Cir SE
- 115 Rock Fence Cir SE
- 115 Rock Fence Cir SE
- 40 Rock Fence 2 Rd SE
- 105 Rock Fence Cir SE
- 97 Rock Fence Cir SE
- 0 Rock Fence Cir SE Unit 7159871
- 0 Rock Fence Cir SE Unit 8093556
- 0 Rock Fence Cir SE Unit 7003640
- 0 Rock Fence Cir SE Unit 7631353
- 0 Rock Fence Cir SE
- 41 Rock Fence Cir SE
- 19 Smiley Ingram Rd SE