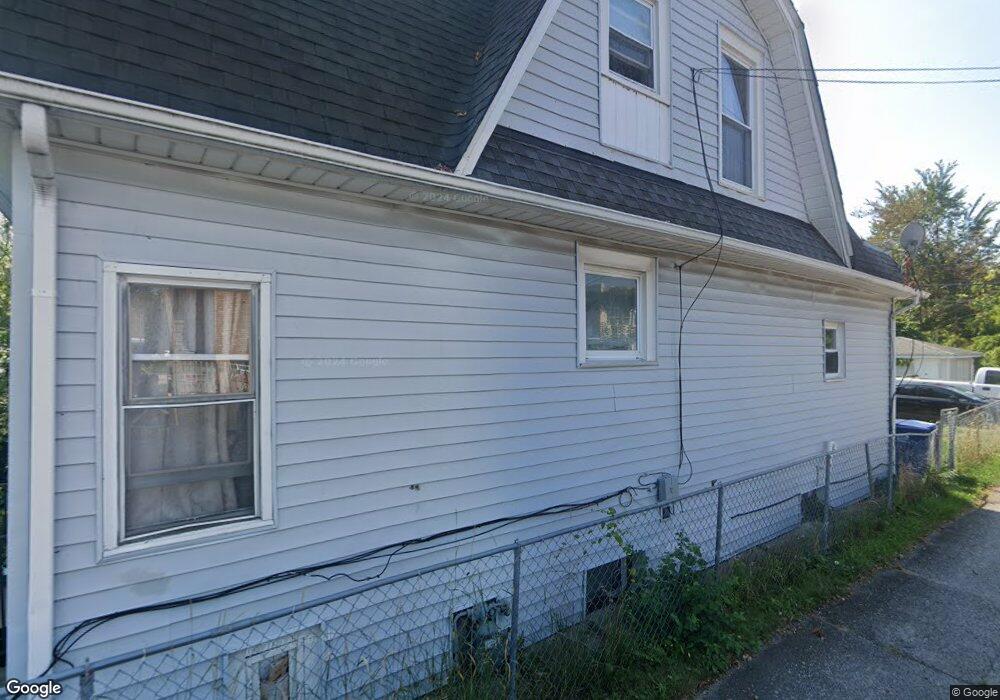
14 S Fulton Ave Waukegan, IL 60085
West Waukegan NeighborhoodEstimated Value: $206,000 - $241,000
3
Beds
2
Baths
1,540
Sq Ft
$145/Sq Ft
Est. Value
About This Home
This home is located at 14 S Fulton Ave, Waukegan, IL 60085 and is currently estimated at $223,549, approximately $145 per square foot. 14 S Fulton Ave is a home located in Lake County with nearby schools including Washington Elementary School, Robert E. Abbott Middle School, and Waukegan High School.
Ownership History
Date
Name
Owned For
Owner Type
Purchase Details
Closed on
Jan 18, 2008
Sold by
U S Bank Na
Bought by
Homesales Inc
Current Estimated Value
Purchase Details
Closed on
Jan 17, 2008
Sold by
Homesales Inc
Bought by
Jimenez Victor H and Jimenez Alicia
Purchase Details
Closed on
Nov 9, 2007
Sold by
Oropeza Noe and Case #07 Ch 691
Bought by
U S Bank Na and Jpm Alt 2006-S1
Purchase Details
Closed on
Feb 11, 2002
Sold by
Felix Capistrano and Felix Gloria
Bought by
Oropeza Filiberto M and Oropeza Noe
Home Financials for this Owner
Home Financials are based on the most recent Mortgage that was taken out on this home.
Original Mortgage
$131,147
Interest Rate
6.95%
Mortgage Type
FHA
Create a Home Valuation Report for This Property
The Home Valuation Report is an in-depth analysis detailing your home's value as well as a comparison with similar homes in the area
Home Values in the Area
Average Home Value in this Area
Purchase History
| Date | Buyer | Sale Price | Title Company |
|---|---|---|---|
| Homesales Inc | -- | First American Title | |
| Jimenez Victor H | $55,000 | First American Title | |
| U S Bank Na | -- | None Available | |
| Oropeza Filiberto M | $133,000 | Stewart Title Company |
Source: Public Records
Mortgage History
| Date | Status | Borrower | Loan Amount |
|---|---|---|---|
| Previous Owner | Oropeza Filiberto M | $131,147 |
Source: Public Records
Tax History Compared to Growth
Tax History
| Year | Tax Paid | Tax Assessment Tax Assessment Total Assessment is a certain percentage of the fair market value that is determined by local assessors to be the total taxable value of land and additions on the property. | Land | Improvement |
|---|---|---|---|---|
| 2024 | $4,508 | $53,444 | $5,932 | $47,512 |
| 2023 | $4,209 | $47,807 | $5,307 | $42,500 |
| 2022 | $4,209 | $43,050 | $4,711 | $38,339 |
| 2021 | $3,749 | $35,959 | $4,052 | $31,907 |
| 2020 | $3,797 | $33,500 | $3,775 | $29,725 |
| 2019 | $3,822 | $30,697 | $3,459 | $27,238 |
| 2018 | $3,014 | $23,312 | $4,894 | $18,418 |
| 2017 | $2,934 | $20,625 | $4,330 | $16,295 |
| 2016 | $2,770 | $17,923 | $3,763 | $14,160 |
| 2015 | $2,710 | $16,041 | $3,368 | $12,673 |
| 2014 | $2,903 | $17,161 | $3,577 | $13,584 |
| 2012 | $3,598 | $18,593 | $3,876 | $14,717 |
Source: Public Records
Map
Nearby Homes
- 49 S Lewis Ave
- 1521 Catalpa Ave
- 132 Dorchester Ct
- 1416 Hamilton Ct
- 23 N Jackson St
- 446 S Jackson St
- 12601 W Atlantic Ave
- 2116 & 2101 Williamsburg Dr
- 304 Powell Ave
- 2115 Lydia St
- 28 N Saint James St
- 613 Washington St
- 610 Bluff St
- 305 Besley Place
- 0 Brookside Ave
- 613 Clarke Ave
- 408 Besley Place
- 557 W Water St
- 215 S Park Ave
- 615 Tiffany Dr
- 16 S Fulton Ave
- 20 S Fulton Ave
- 1709 Washington St
- 24 S Fulton Ave
- 1715 Washington St
- 26 S Fulton Ave
- 1717 Washington St
- 13 S Fulton Ave
- 28 S Fulton Ave Unit 2
- 15 S Fulton Ave
- 17 S Fulton Ave
- 1721 Washington St
- 19 S Fulton Ave
- 25 S Fulton Ave
- 32 S Fulton Ave
- 27 S Fulton Ave
- 1723 Washington St
- 1702 Washington St Unit 202
- 1702 Washington St Unit 200
- 1702 Washington St Unit L10